PenTest+ : The Microsoft Windows Operating System, Windows tools
PenTest+ : The Microsoft Windows Operating System, Windows tools
In this post I'll be looking at the infamous sysinternals suite which I believe pretty much gave Corporations only one choice when it came to managing and regulating their employee computers, and their own for that matter - and had a tool for pretty much every task at hand.
There are over 70 different tools for
- File and Disk Utilities
- Networking Utilities
- Process Utilities
- Security Utilities
- System Information
- Miscellaneous
The procmon and sysmon tools are for monitoring processes (in the former) and event logs (in the latter). The Sysinternals tools are extremely popular among IT professionals who manage Windows systems. These tools are so popular that even red-teams and adversaries alike use them.
Installation
If you wish to download a tool or two but not the entire suite, you can navigate to the Sysinternals Utilities Index page, https://docs.microsoft.com/en-us/sysinternals/downloads/, and download the tool(s). If you know which tool you want to download, then this is fine. The tools are listed in alphabetical order and you can see the different categories on the left pane
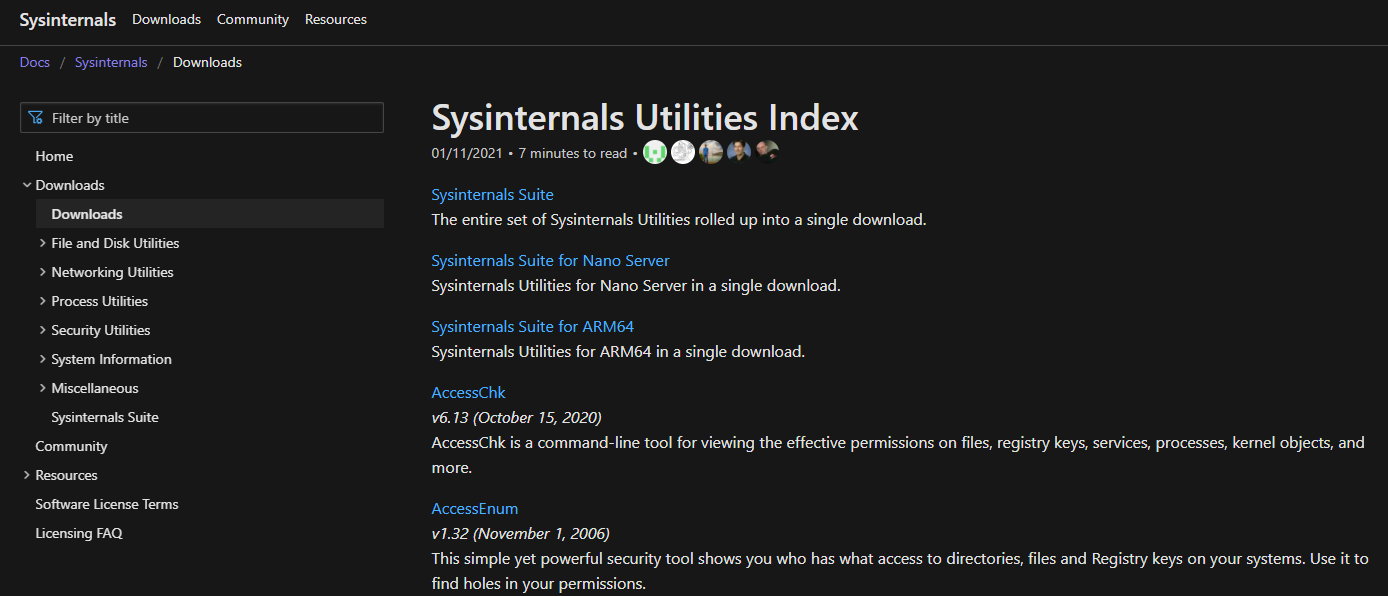
And if we wanted to download something to monitor process utilities , click Process Utilities on the left plan and you can see the Process Monitor result for example - giving us the procmon tool.
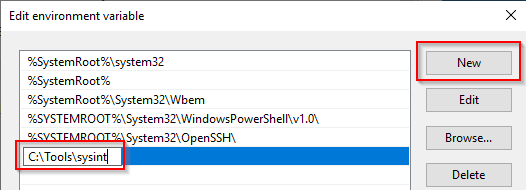
The tools will by default be installed in C:\Tools\sysint and we can add this directory to our path so that we can run the tools from the command line...
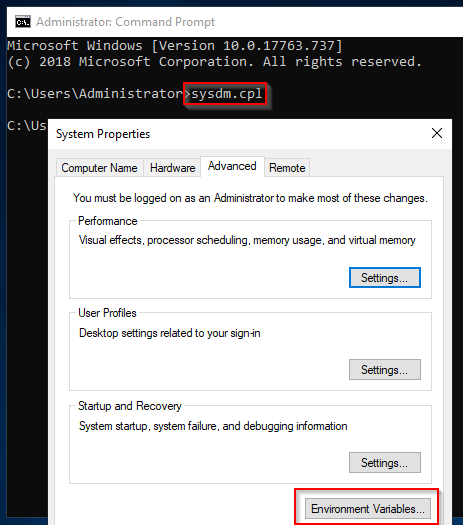
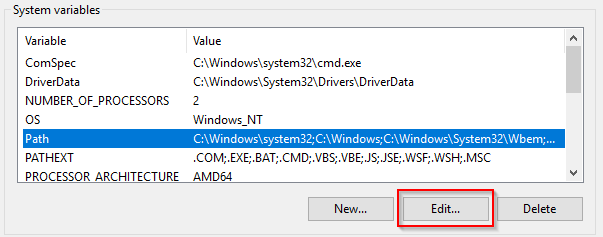
Once here we need to edit our environment path
Adding the new entry for C:\Tools\sysint
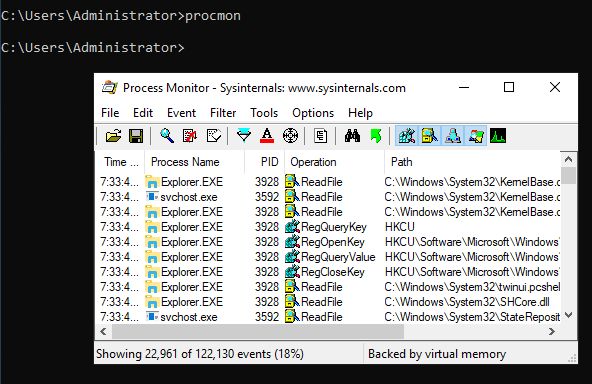
Now save that and we should be able to load procmon from the command line
Install all tools with Powershell
If you want to go all in, then you can get the entire suite with this one-liner
Download-SysInternalsTools C:\Tools\Sysint
File and Disk Utilities
The first tool we'll look at is the sigcheck tool, which - as the name implies - checks the signature , timestamp information and can also reference the VirusTotal database to see whether the signature of the file is known to be malicious. This helps when checking the safety of downloaded files and/or executables.
When first starting sigcheck you may have to do
sigcheck -accepteula

;; if you haven't loaded it before, thus accepting the terms - to use extensions like the
;; VirusTotal functionality.
Now let's take a peek at the options
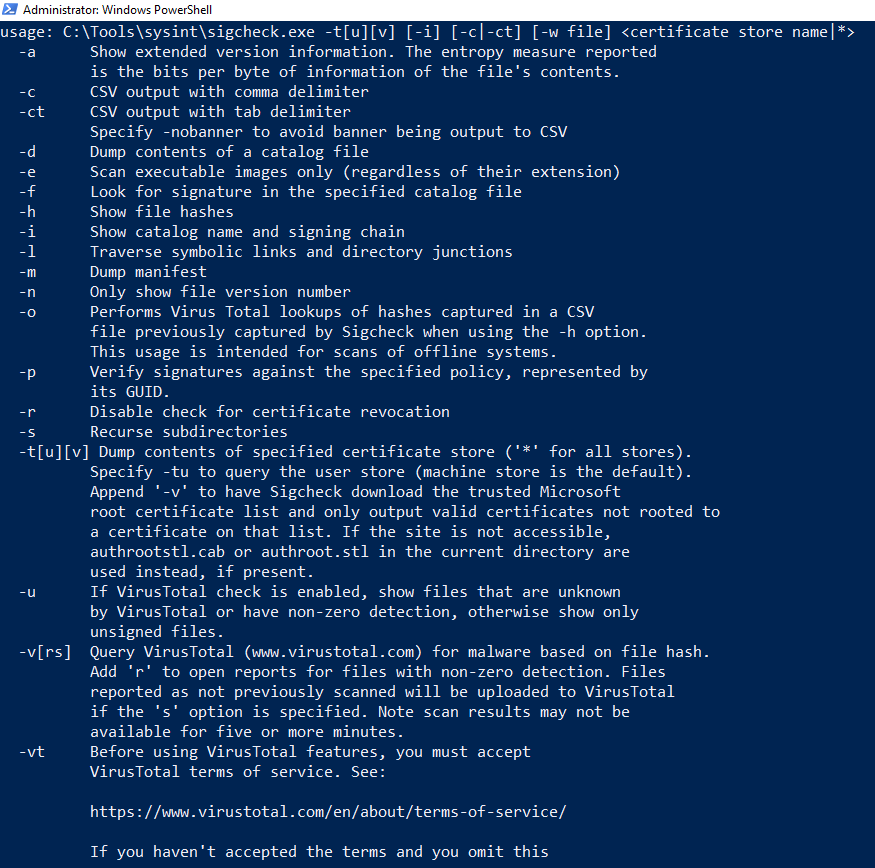
Looking at the -u option, this will scan for unsigned files - those that aren't trusted by the system , so we can comb through the C:\Windows\System32 folder , where all executables are held apart from Explorer.exe which is kept in C:\Windows . We can stick the -e flag on the end too,

If any executables did come up, then we would have to investigate...
The streams tool
"The NTFS file system provides applications the ability to create alternate data streams of information. By default, all data is stored in a file's main unnamed data stream, but by using the syntax file:stream, you are able to read and write to alternates."
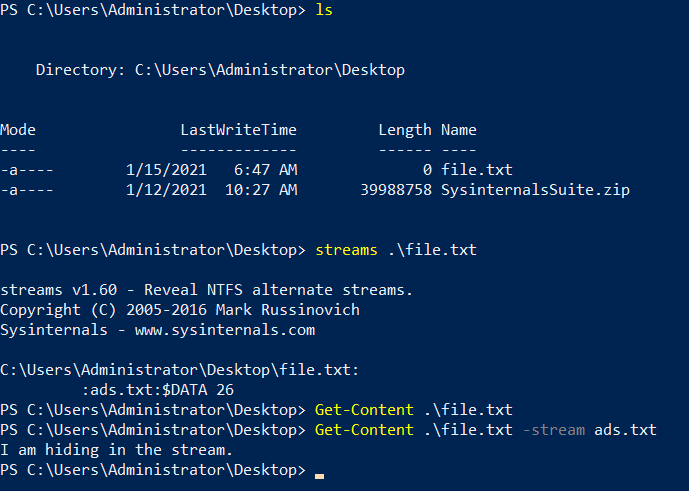
Alternate Data Streams (ADS) is a file attribute specific to Windows NTFS (New Technology File System). Every file has at least one data stream ($DATA) and ADS allows files to contain more than one stream of data. Natively Window Explorer doesn't display ADS to the user. There are 3rd party executables that can be used to view this data, but Powershell gives you the ability to view ADS for files.
Malware writers have used ADS to hide data in an endpoint, but not all its uses are malicious. When you download a file from the Internet unto an endpoint, there are identifiers written to ADS to identify that it was downloaded from the Internet.
streams -accepteula
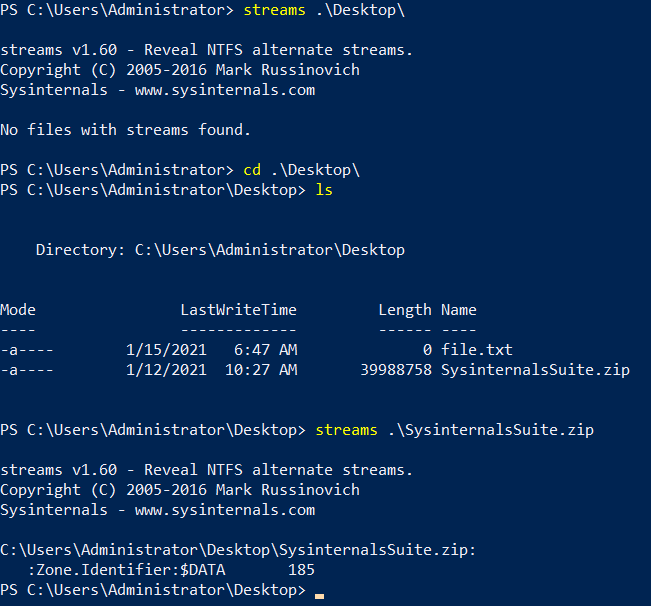
So normally we wouldn't get any other stream but Zone.Identifier is used here to denote the
Networking Utilities
TCPView is a Windows program that will show you detailed listings of all TCP and UDP endpoints on your system, including the local and remote addresses and state of TCP connections. On Windows Server 2008, Vista, and XP, TCPView also reports the name of the process that owns the endpoint. TCPView provides a more informative and conveniently presented subset of the Netstat program that ships with Windows. The TCPView download includes Tcpvcon, a command-line version with the same functionality.
This is a good time to mention that Windows has a built-in utility that provides the same functionality. This tool is called Resource Monitor. There are many ways to open this tool. From the command line use resmon.

And if we turn off Show Unconnected Endpoints in the Options menu.

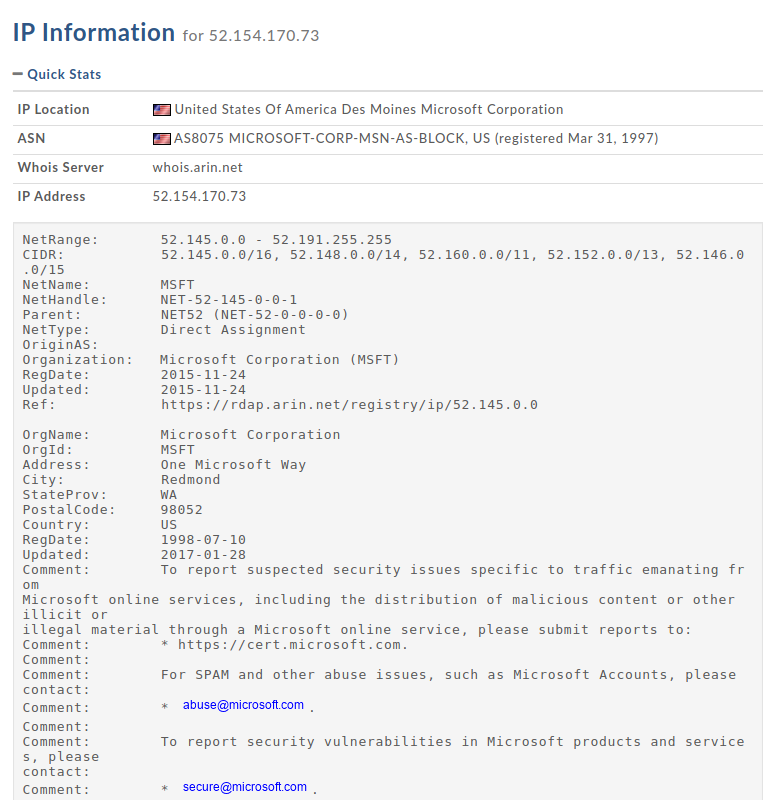
Using the whois tool for converting that IP address into a hostname we see the company is
Process Utilities
On this blog I have briefly gone over the concept of persistence - which is where an attacker will try to implant a shell somewhere on the system like in the registry. When we start up the shell session would then - in theory - be started too... But as a system admin how could we look through and peer at all the processes that automatically run at startup ? I introduce , autoruns.
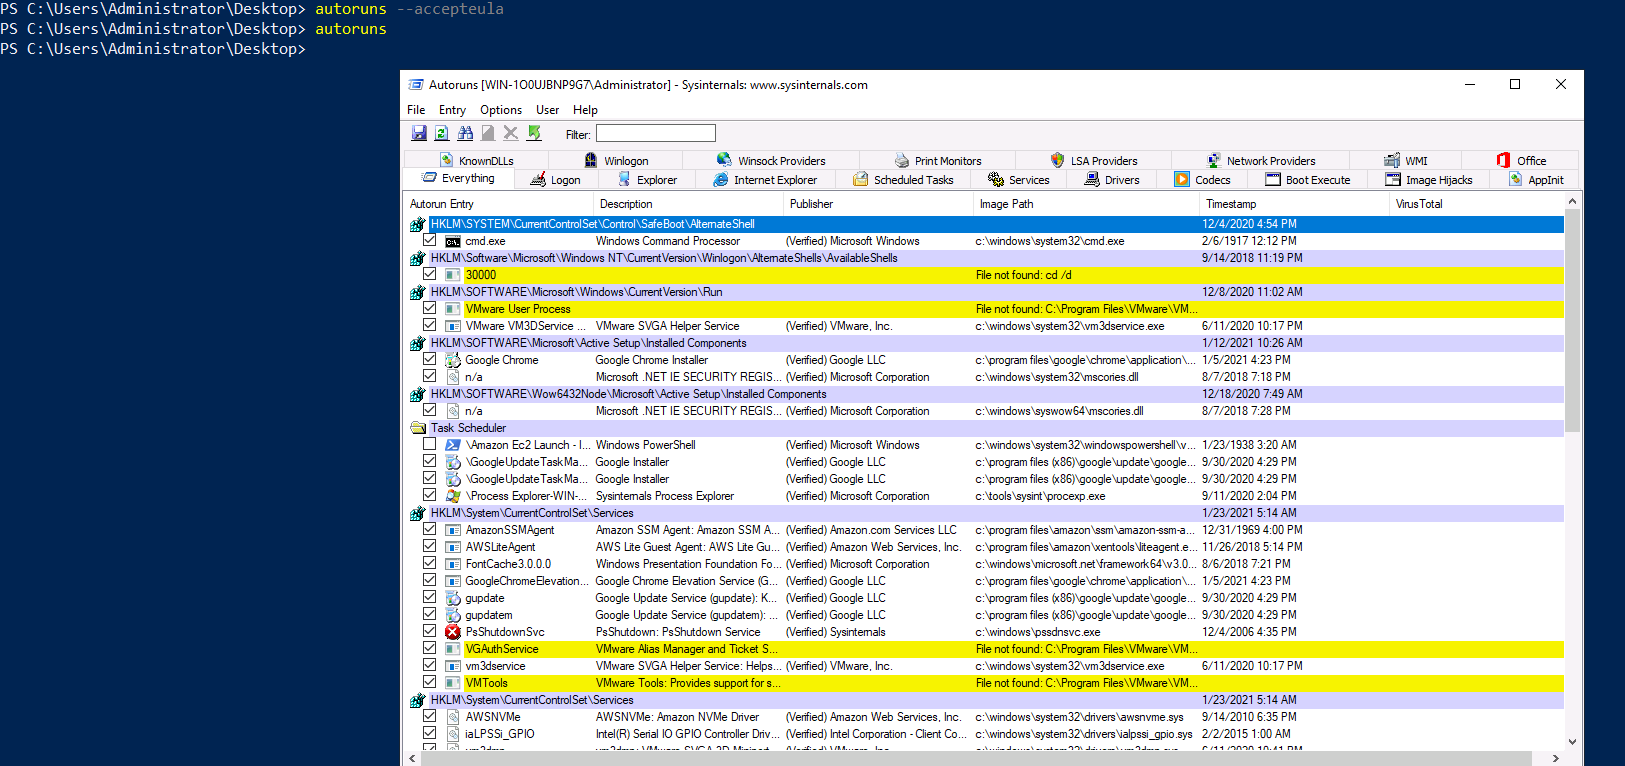
By clicking on the everything tab we get a lot of data, we see that for each of the registry keys we can see all the given programs in those categories. Now in all fairness, an attacker probably won't hide in this obvious zone but it's worth checking out.
Procdump
Now onto a tool which dumps the running contents of a process, to see the conditions, variables etc of a program to figure out why such a thing crashed, why there was a surge in activity - you can script this to watch running processes with procdump to create dump files for any app that drastically increases CPU usage, so as when an exploit is attempting to enumerate or maybe they are trying to exfiltrate.
Likewise we can use the GUI Process Explorer to achieve the same sort of thing:

Make sure you run these tools with admin permissions , otherwise you cannot create dump files.
Process Monitor (procmon)
Process Monitor is an advanced monitoring tool for Windows that shows real-time file system, Registry and process/thread activity. It combines the features of two legacy Sysinternals utilities, Filemon and Regmon, and adds an extensive list of enhancements including rich and non-destructive filtering, comprehensive event properties such as session IDs and user names, reliable process information, full thread stacks with integrated symbol support for each operation, simultaneous logging to a file, and much more. Its uniquely powerful features will make Process Monitor a core utility in your system troubleshooting and malware hunting toolkit.
System Information
Use Win-Obj
System Logging
Before I jump into the tools, I want to talk a little bit about what event logs are, and why we log in the first place , what we can view depends on how much we save and store data etc. Event logs will try to save as much of the information of a running process as possible, with different configurations saving different categories - they can then be used as part of a weekly audit , investigation or to diagnose a particular program with the program.
If any section of the infrastructure is experiencing an issue, the event logs can be queried to see any clues about what led to the issue. The operating system, by default, writes messages to these logs building an incredibly detailed canvas or quick sketch of the infrastructure. When we monitor many different aspects of the system we can begin to build models, notice patterns and see the correlations between different parts of the system which can confirm different hypotheses we make during investigations.
This need for logging many different parts of a system is what birthed the idea of a SIEM - which is a Security Information and Event Management software that sits watching the traffic on the network. Using the logs as the primary function , it can leverage forensic software, provide alerts based on the content it sees , execute instructions in response to certain situations and aims to detect threats through advanced security monitoring.
Viewing Event Logs in Windows
The Windows Event Logs are not text files that can be viewed using a text editor. However, the raw data can be translated into XML using the Windows API. The events stored in these log files are stored in a proprietary binary format with a .evt or .evtx extension - denoting environment. The log files with the .evtx file extension typically reside in C:\Windows\System32\winevt\Logs.
There are 3 main ways of accessing these event logs within a Windows system:
Event Viewer(GUI-based application)Wevtutil.exe- Windows Event Utility (command-line tool)Get-WinEvent(PowerShell cmdlet)
Each method of accessing the event logs has its pros and cons. In this section, we'll look at the Event Viewer first.
In any Windows system, the Event Viewer (an MMC [Microsoft Management Console] snap-in) can be launched by simply right-clicking the Windows icon in the taskbar and selecting Event Viewer.
Event Viewer has 3 panes.
- The pane on the left provides a hierarchical tree listing of the event log providers.
- The pane in the middle will either display a general overview and summary or the events specific to a selected provider.
- The pane on the right is the actions pane.
What can be logged will be any of:
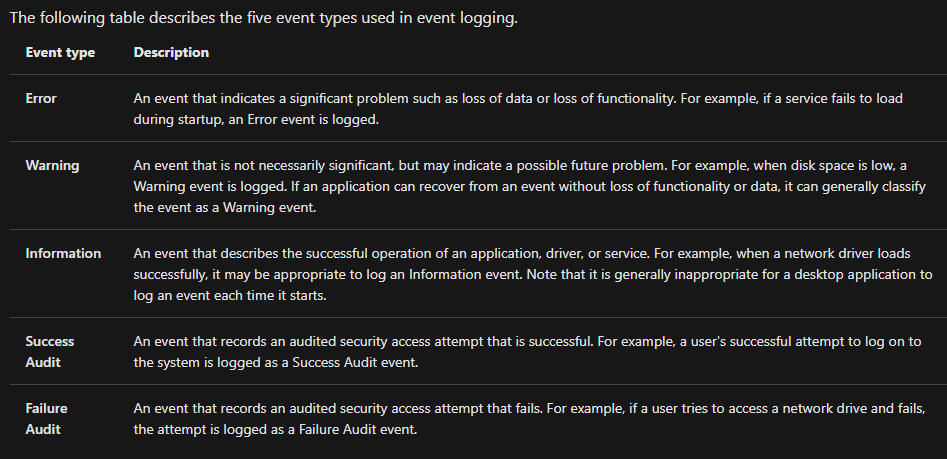
Here's the default screen
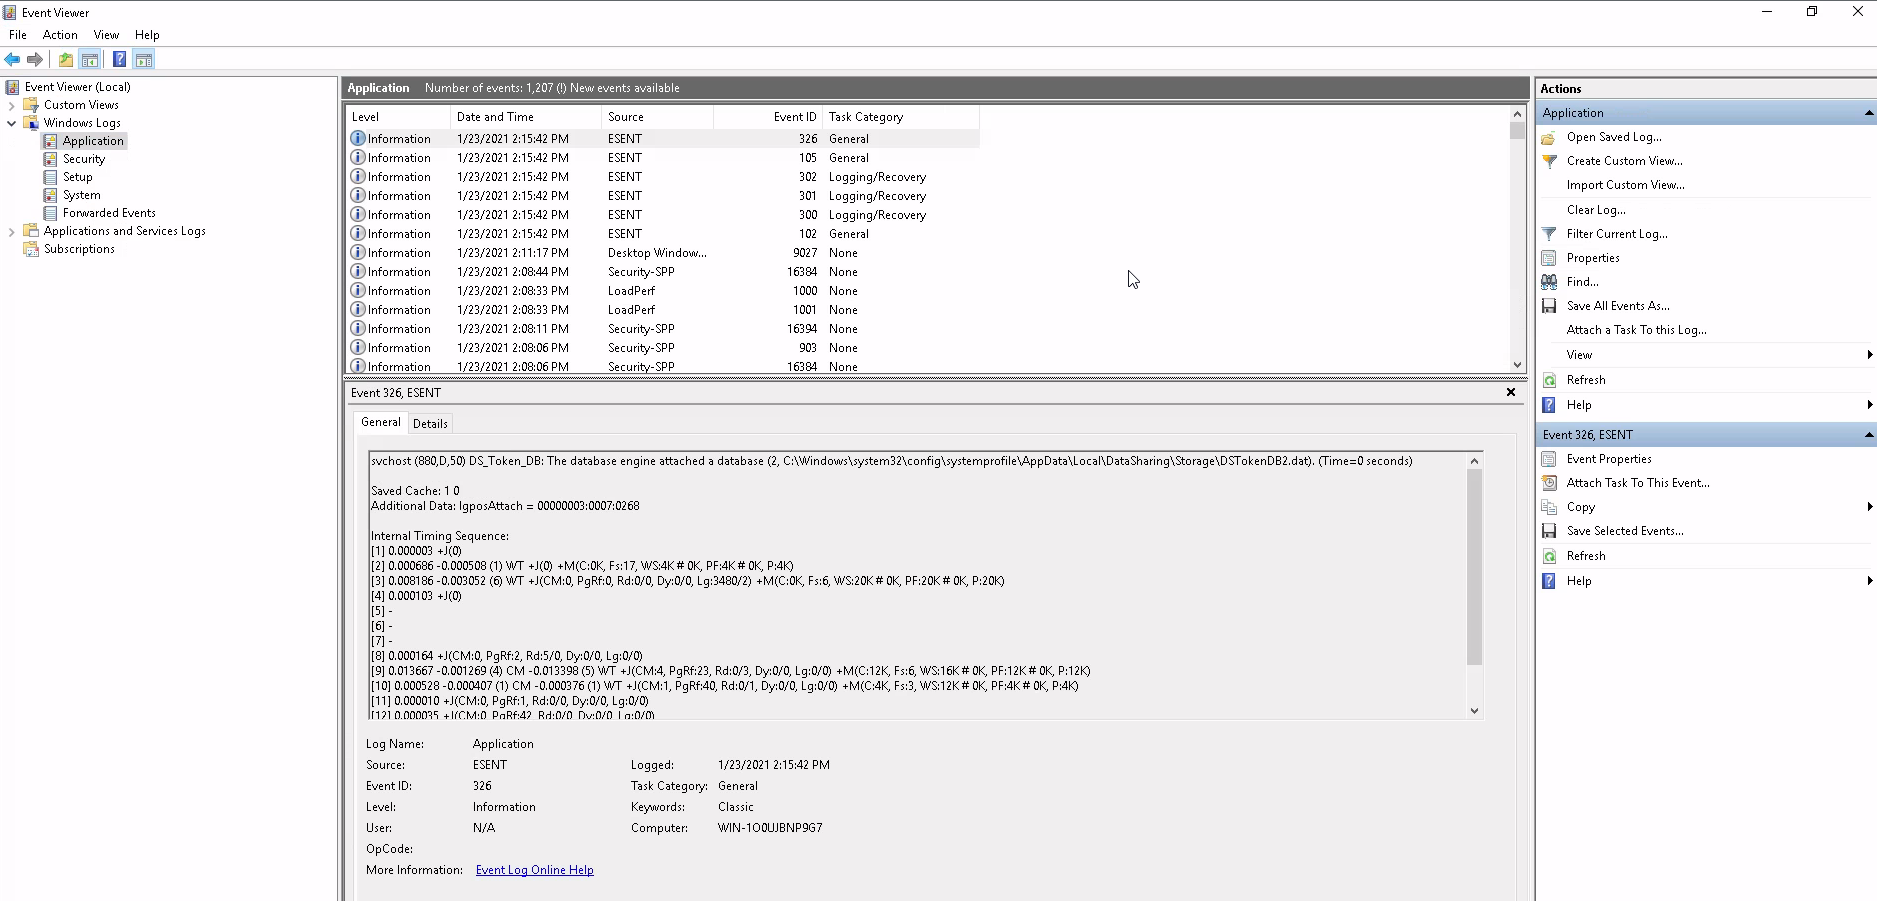
The left pane is what the event viewer has broken down into the categories that we log, so
- Application . Contains events logged by applications. For example, a database application might record a file error. The application developer decides which events to record.
- Security. Contains events such as valid and invalid logon attempts, as well as events related to resource use such as creating, opening, or deleting files or other objects. An administrator can start auditing to record events in the security log.
- System. Contains events logged by system components, such as the failure of a driver or other system component to load during startup.
- Custom log. Contains events logged by applications that create a custom log. Using a custom log enables an application to control the size of the log or attach ACLs for security purposes without affecting other applications.
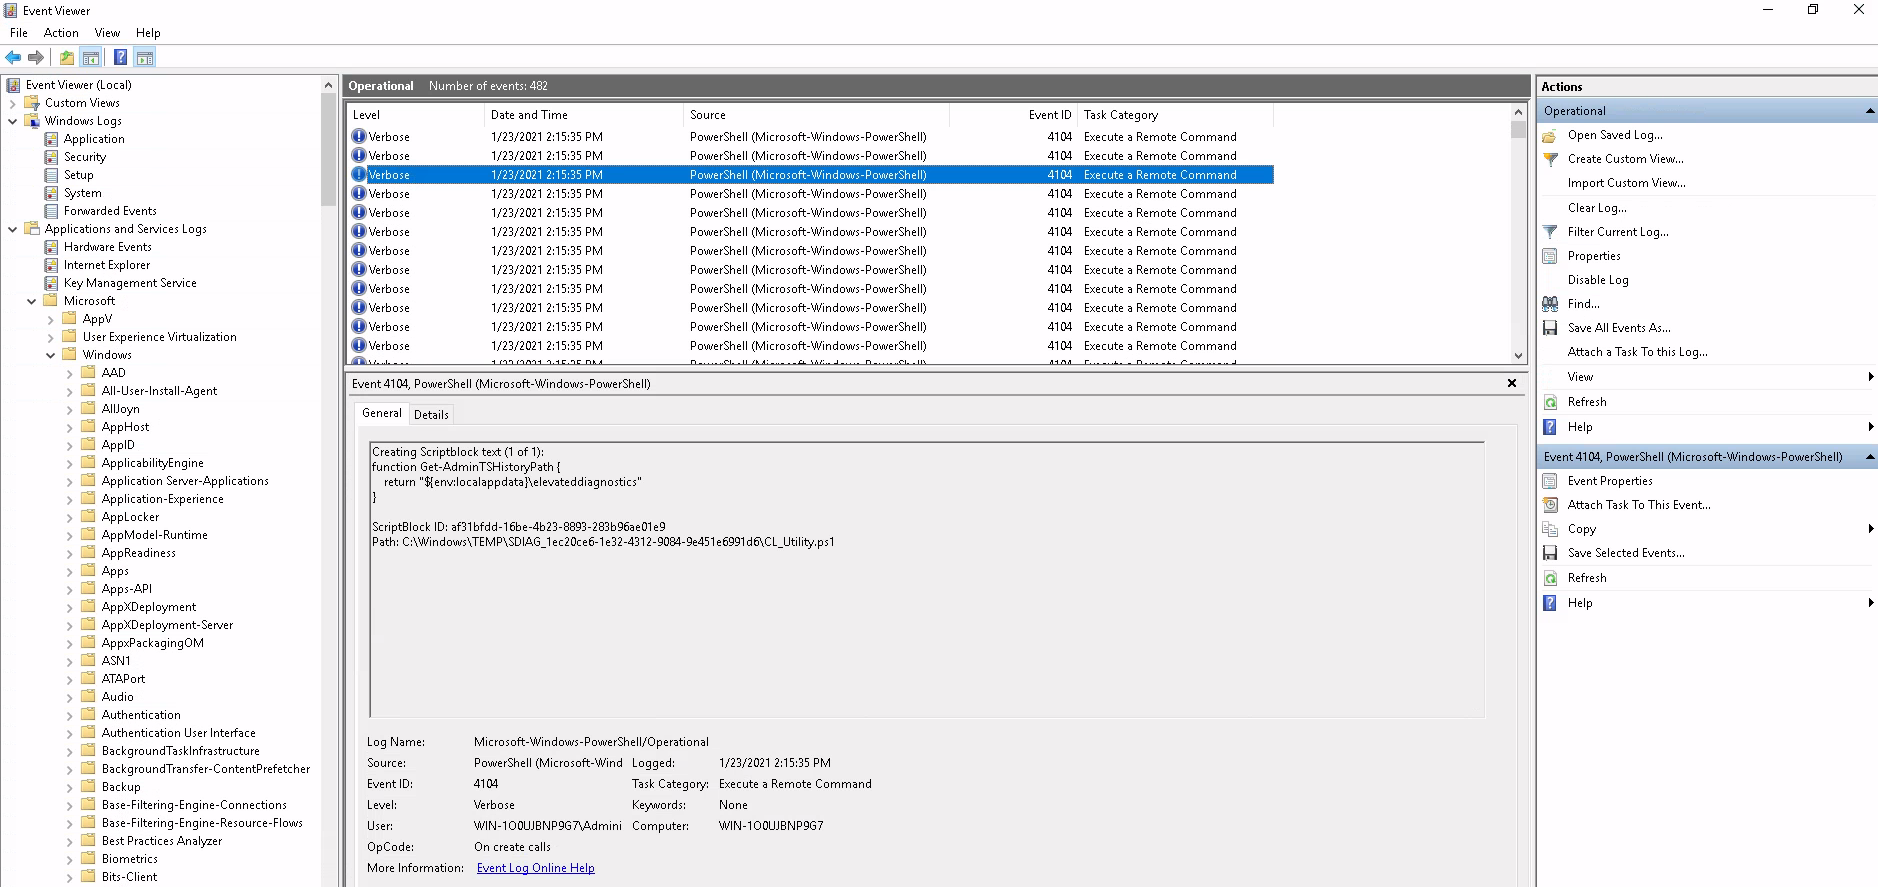
If we log our powershell usage, then guess what - it can be monitored. Here is a very in-depth look at all the commands executed on this machine.
Done by going to
Applications and Service Logs > Microsoft > Windows > PowerShell > Operational
We can right-click on operational and hit properties:
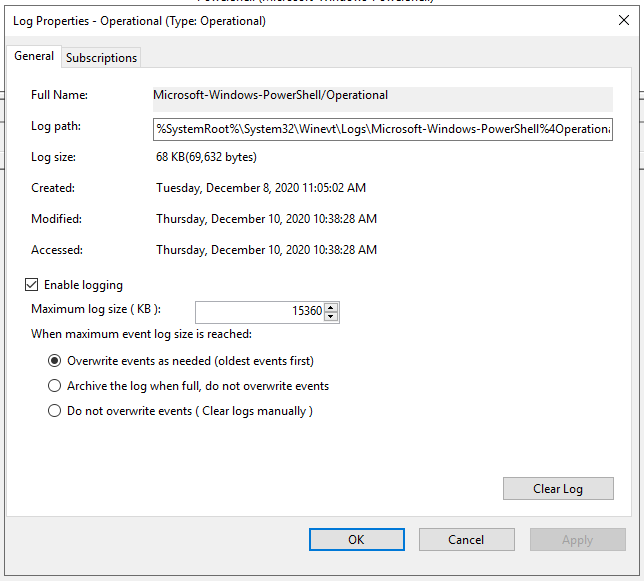
You see the log location, log size, and when it was created, modified, and last accessed. Within the Properties window, you can also see the maximum set log size and what action to take once the criteria are met. This concept is known as log rotation. These are discussions held with corporations of various sizes. How long to keep logs and when it's permissible to overwrite the logs with new data.
Within the Actions pane, you can open a saved log. This is useful if the remote machine can't be accessed. The logs can be provided to the analyst. You will perform this action a little later.
The Create Custom View and Filter Current Log are nearly identical. The only difference between the 2 is that the By log and By source radio buttons are greyed out in Filter Current Log. Reason for that? The filter you can make with this specific action only relates to the current log. Hence no reason for 'by log' or 'by source' to be enabled.
Filtering PowerShell logs
Let's see all the events with ID 4104. Click on Filter Current Log and enter just the ID
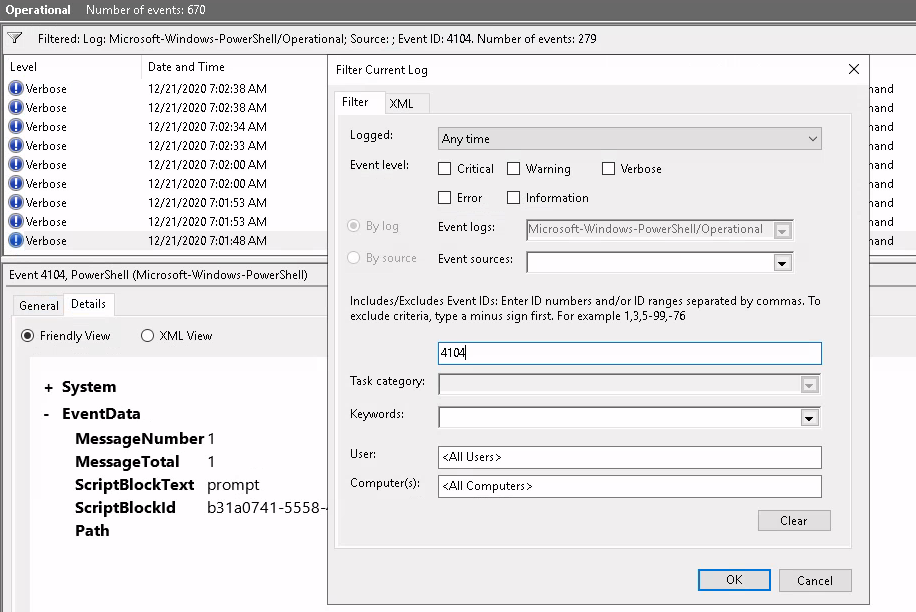
The list is ordered like a stack, so the first entry is on the bottom and the most recent log is on the top. To see the first or second commands in the session would mean we have to scroll all the way down...
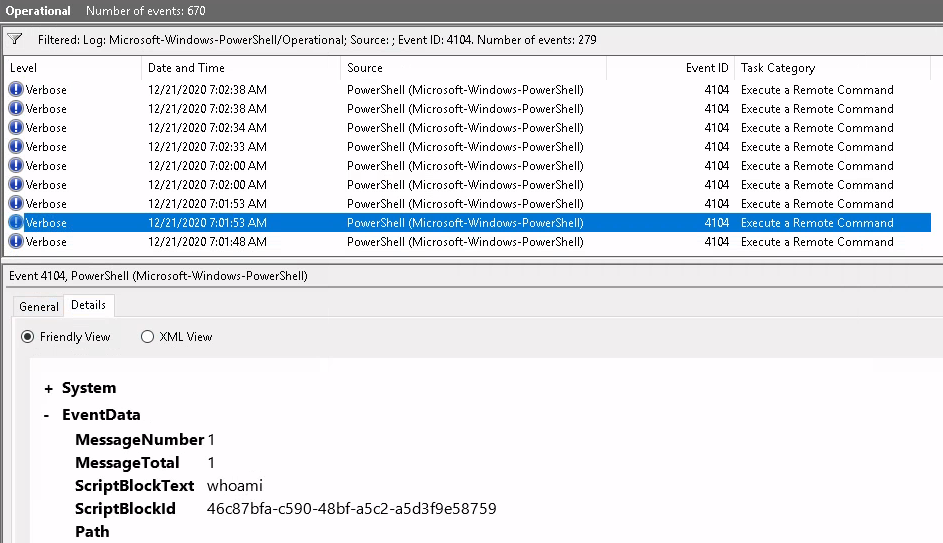
There are also PowerShell logs in the OpenSSH folder , let's take a look in there as I couldn't find Event ID 800 in here:

wevtutil.exe
So, you played around with Event Viewer. Imagine you have to sit there and manually sift through hundreds or even thousands of events (even after filtering the log). Not fun. It would be nice if you could write scripts to do this work for you. We will explore some tools that will allow you to query event logs via the command line and/or PowerShell.
This tool enables you to retrieve information about event logs and publishers. You can also use this command to install and uninstall event manifests, to run queries, and to export, archive, and clear logs.
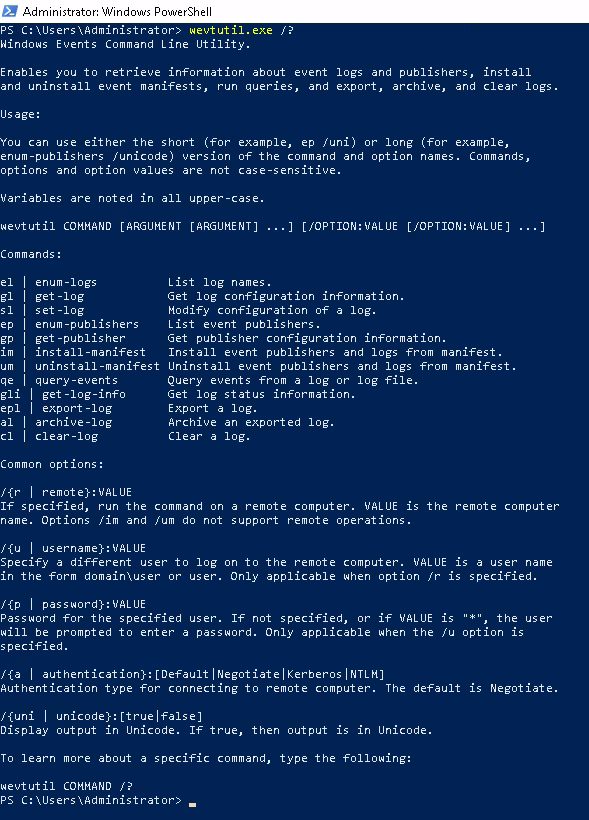
So we could run
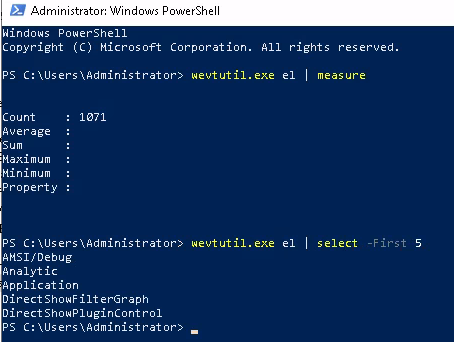
wevtutil.exe el

;; though this outputs all the names of the logs we hold which is way too large, we could
;; pipe it through filters
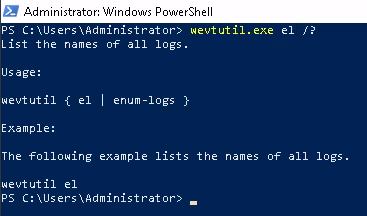
To see how many different names we log we can do:
To query a specific system log we can do:
;; lf stands for log file and when we set this to true we tell wevtutil to work from here
wevtutil.exe /lf:true qe "C:\Windows\System32\winevt\Logs\Windows PowerShell.evtx"
The qe option usually maps to one of the main log types
Application
System
Security
Setup
Forwarded Events
This command for example will take the first the 3 logs from the Application type
wevtutil qe Application /c:3 /rd:true /f:text
Lastly, the Get-WinEvent cmdlet
This is the last way we'll be going over how to access and manage these swathes of data. We can see the different options by doing:

Now to use the full power of our filters like Where-Object , we shall want to see all the different fields we can specify - so just run a more general command first, like:
Get-WinEvent -LogName Application
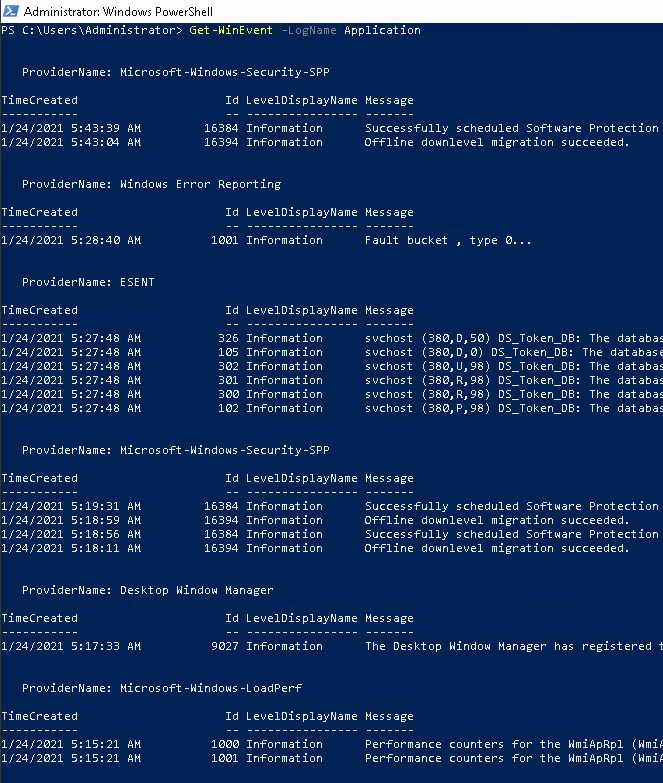
So we can specify by provider name, let's try and get all the logs by the Windows Error Reporting provider
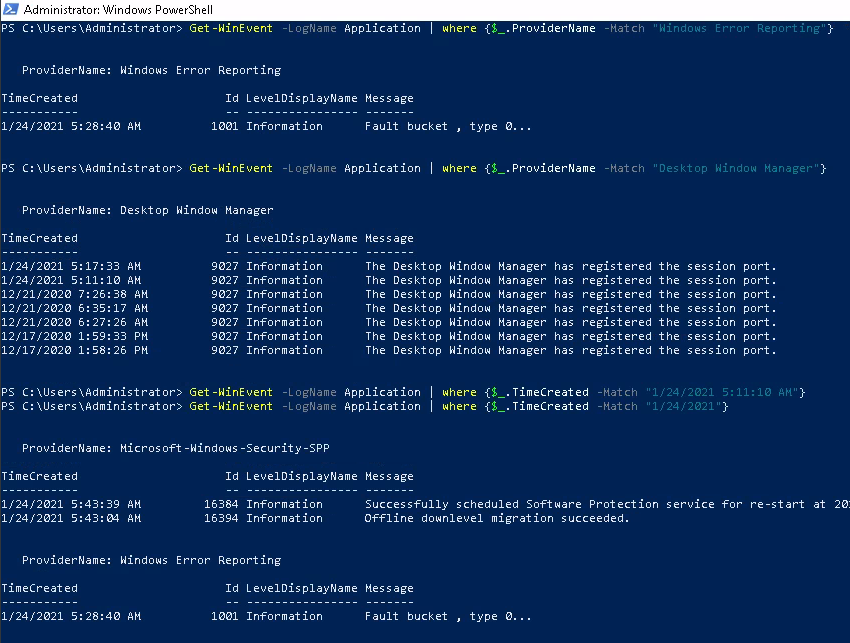
The $_ is the placeholder for the given value passed to where on each iteration, which has its property checked to our match. You could also do it this way:

Another way would be to , instead of listing individual logs , to list providers and see all the logs that application provides us...
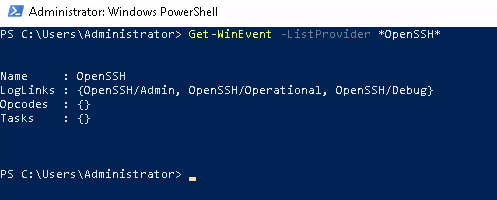
For any given Log provider they will only have a set few IDs that they use for each activity which would be logged. OpenSSH for example only has IDs for :
(Get-WinEvent -ListProvider OpenSSH).Events | Format-Table Id, Description
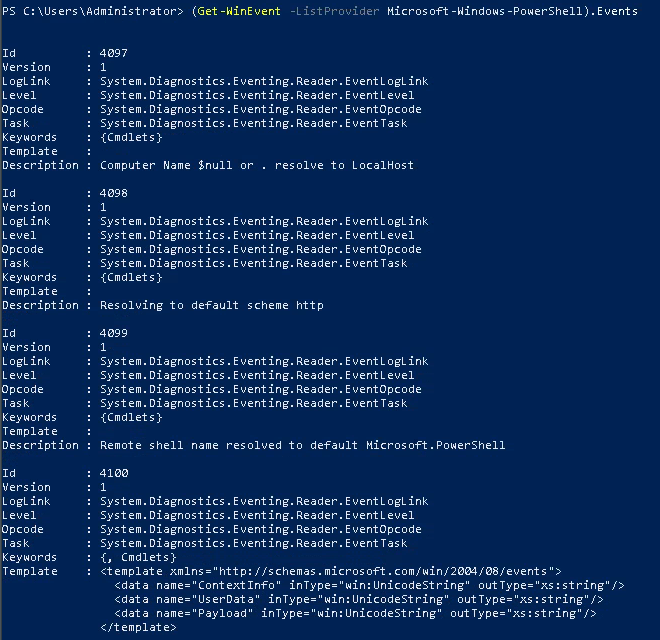
Now whilst this will work, it gives %1:%2 as the description which obviously means that there has been a formatting error in the code... If we tried instead Microsoft-Windows-Powershell this seems to be fine:
(Get-WinEvent -ListProvider Microsoft-Windows-PowerShell).Events
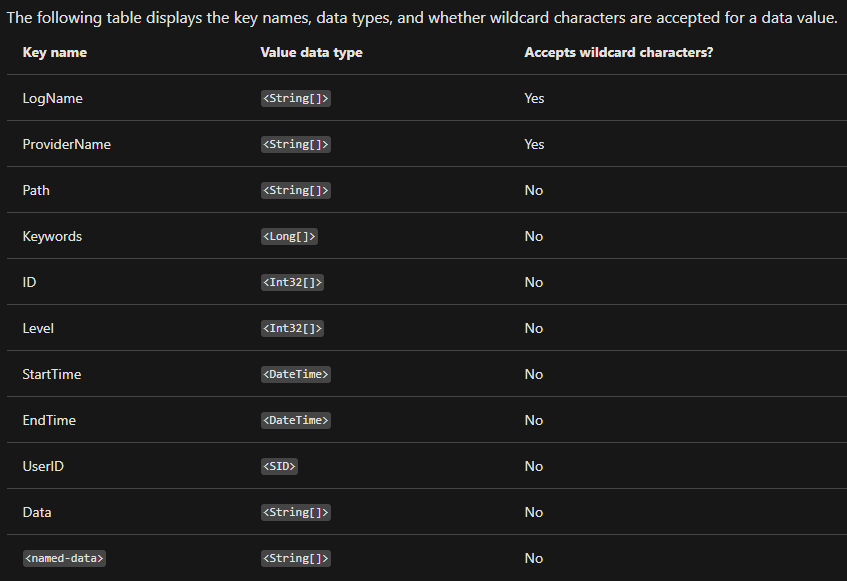
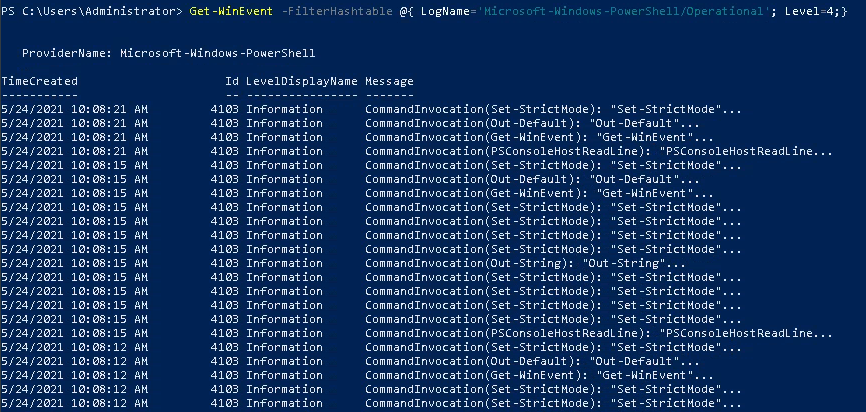
We can make use of the FilterHashTable method that comes with the program , which takes a map of keys and values (key denoting the property to check, and the values we want to use as filter) . This allows more filters to be easily added on, so with the given code:
Get-WinEvent -FilterHashtable @{LogName='Microsoft-Windows-PowerShell/Operational'; ID=4104}
This is the table of acceptable values, moreover this is the set of attributes that all Log objects will have:
But if we run this command, it looks a bit boring
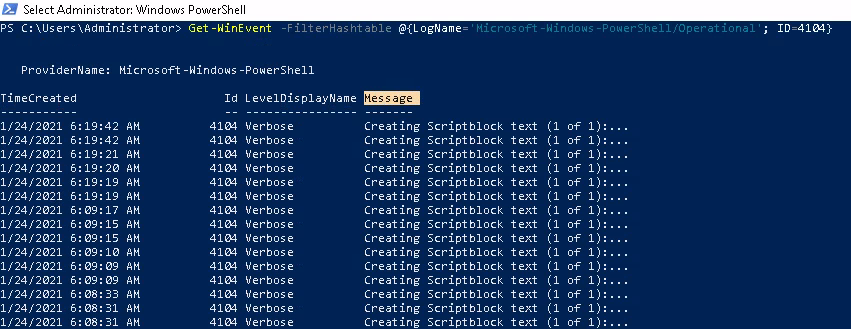
I've highlighted the thing which we can modify to get to the "spicier" messages ... First we can get that message column by using select
select -Property Message

;; or

select {$_.Message}
We can use a hash-table , which is the PowerShell equivalent of a traditional hash-map , to have fine-grained control over what Get-WinEvent outputs:
Get-WinEvent -FilterHashtable @{LogName='Microsoft-Windows-PowerShell/Operational'; ID=4104} | select -Property Message | Select-String -Pattern 'SecureString'
We can use Event Viewer for a particular log and see the different attributes when constructing our hash-table:
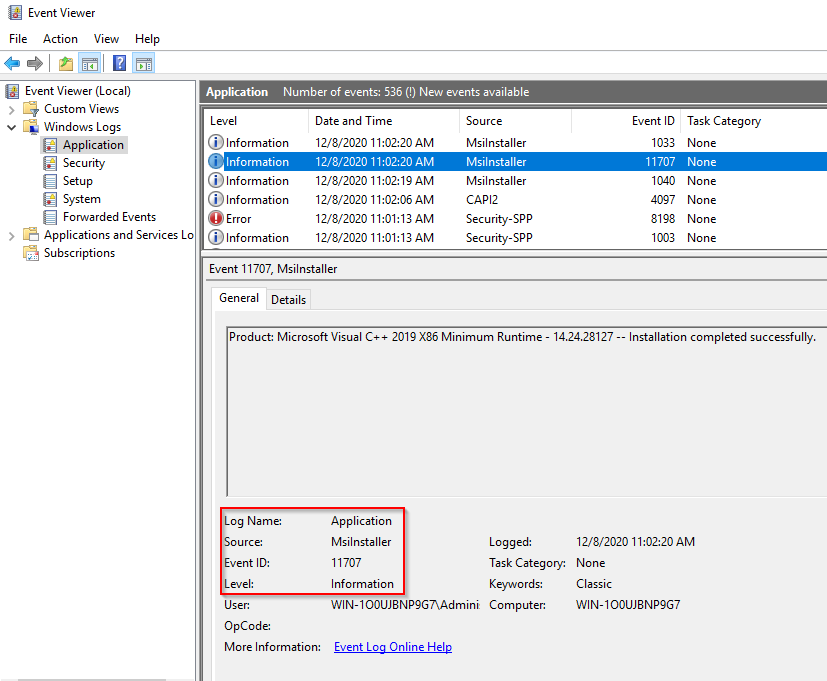
Where we could then construct a hash-table which looks like this:

Putting theory into practice
We will be doing a few example scenarios to really put everything we've learnt together , with a little help from the internet of course ...
Scenario 1
The server admins have made numerous complaints to Management regarding PowerShell being blocked in the environment. Management finally approved the usage of PowerShell within the environment. Visibility is now needed to ensure there are no gaps in coverage. You researched this topic: what logs to look at, what event IDs to monitor, etc. You enabled PowerShell logging on a test machine and had a colleague execute various commands.
As I'm a newbie , I have to do this step by step ... First I get identify the name of the provider so I know the log name ... From there I can use something like a FilterHashTable to narrow down what specific event I want.
1. Get-WinEvent -ListProvider "*PowerShell*"
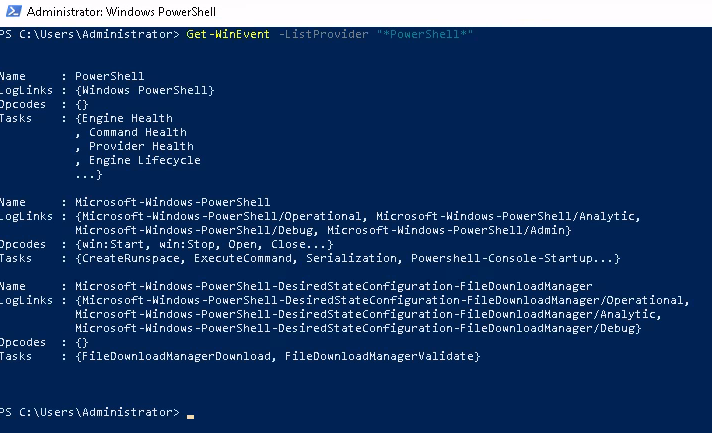
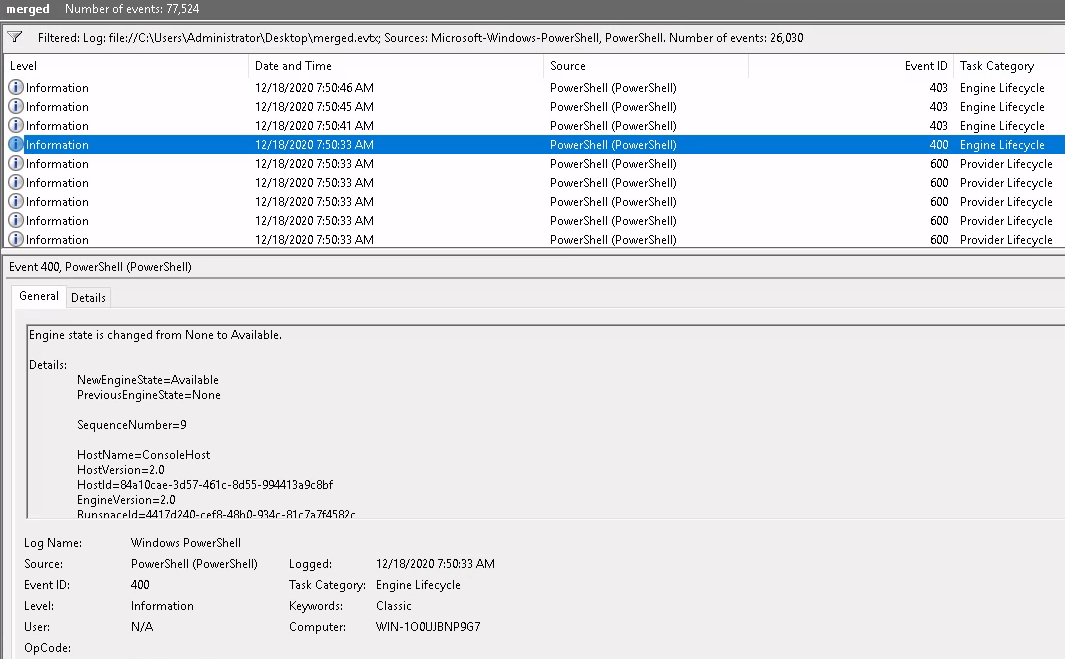
So these are the things I could feed to -LogName . With some researching I was able to find this article which helped answer my question about what ID can help us identify a downgrade attack. The easiest way to skim through logs , in my opinion , is to rely on the Event Viewer GUI - it lets me specify all potential PowerShell log names - then we can look for ID 400.
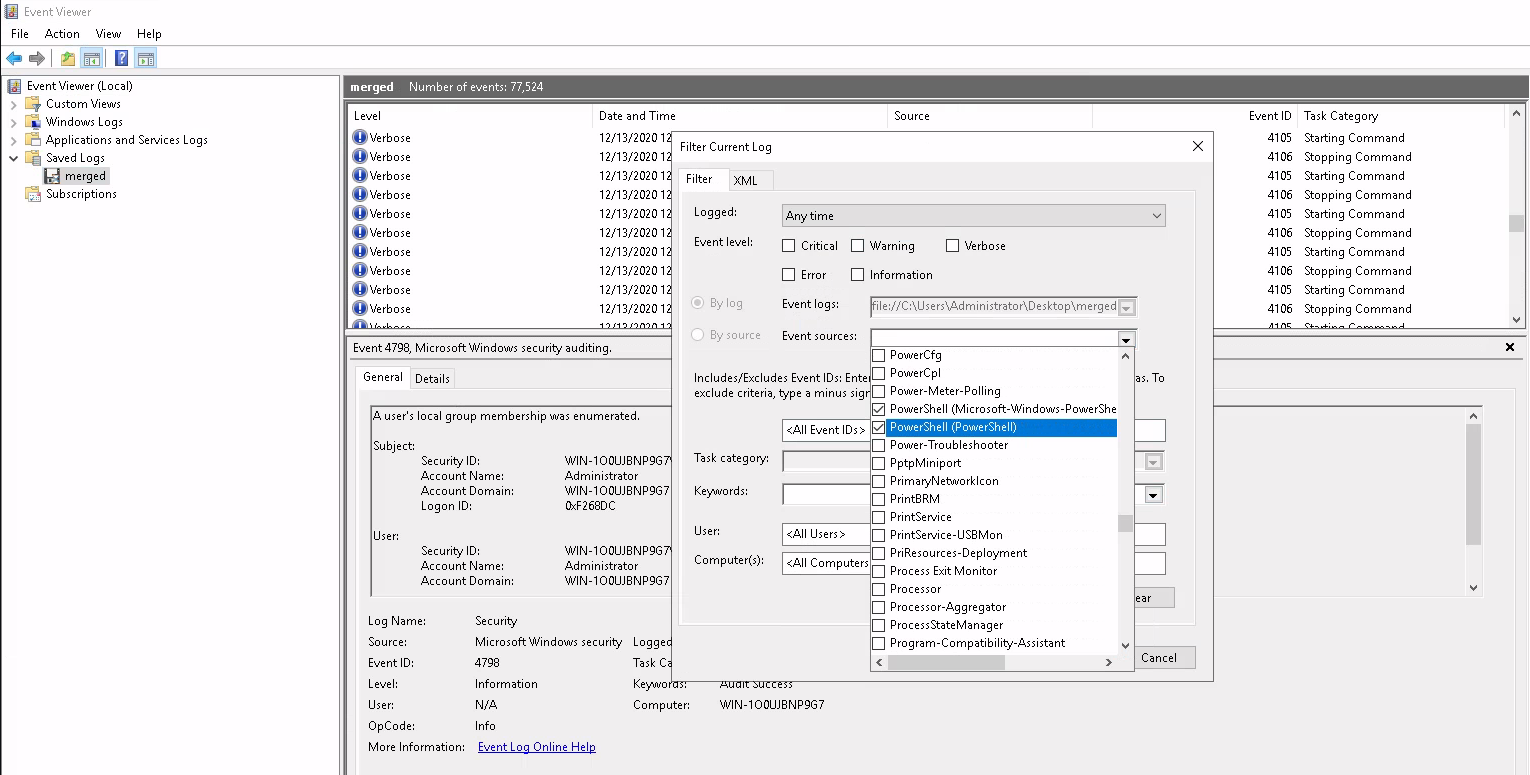
I've spotted ID 400!
Scenario 2
A log clear event has been recorded , what is the Event Record ID ?
Now this is actually quite a tricky question as there are multiple log types (Application, Security, System) and so on and each of them could be cleared whilst the other one is in tact. Applications also keep their own logs and maybe this was the thing that got cleared ... Traditionally, Event ID 1102 is used for when the audit log gets cleared, which records things like logons, access success/failure attempts etc.
At the end of the day, they are all Microsoft-Windows-Eventlog events and we can see all the events this provider will be emitting with
Get-WinEvent -ListProvider 'Microsoft-Windows-Eventlog'
Then to get the actual events
(Get-WinEvent -ListProvider 'Microsoft-Windows-Eventlog').Events
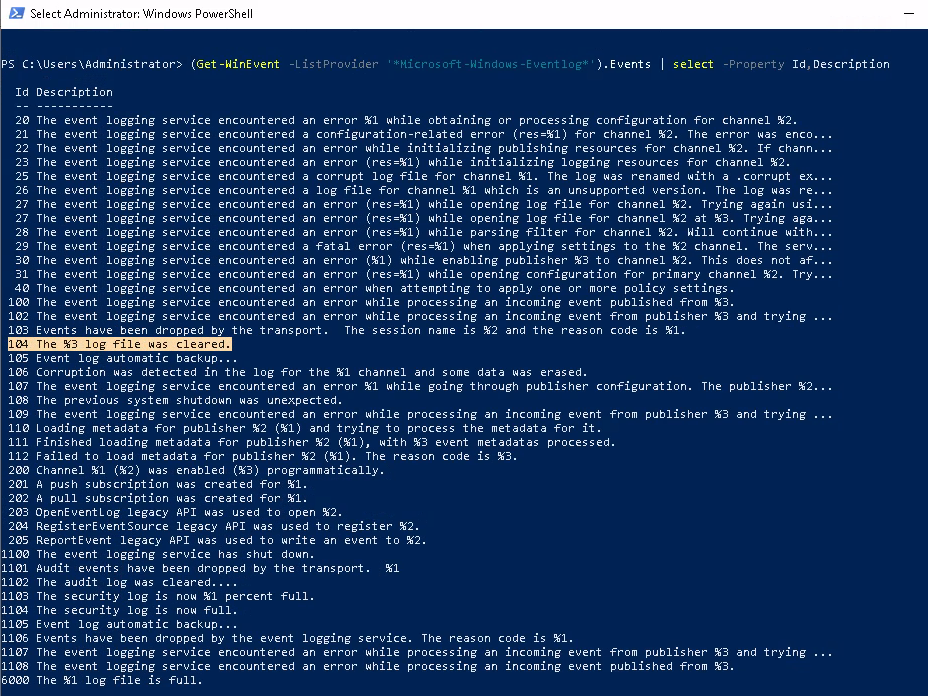
There we go ! This ID actually maps to an application log being cleared - let's try seeing this Event ID in event viewer:
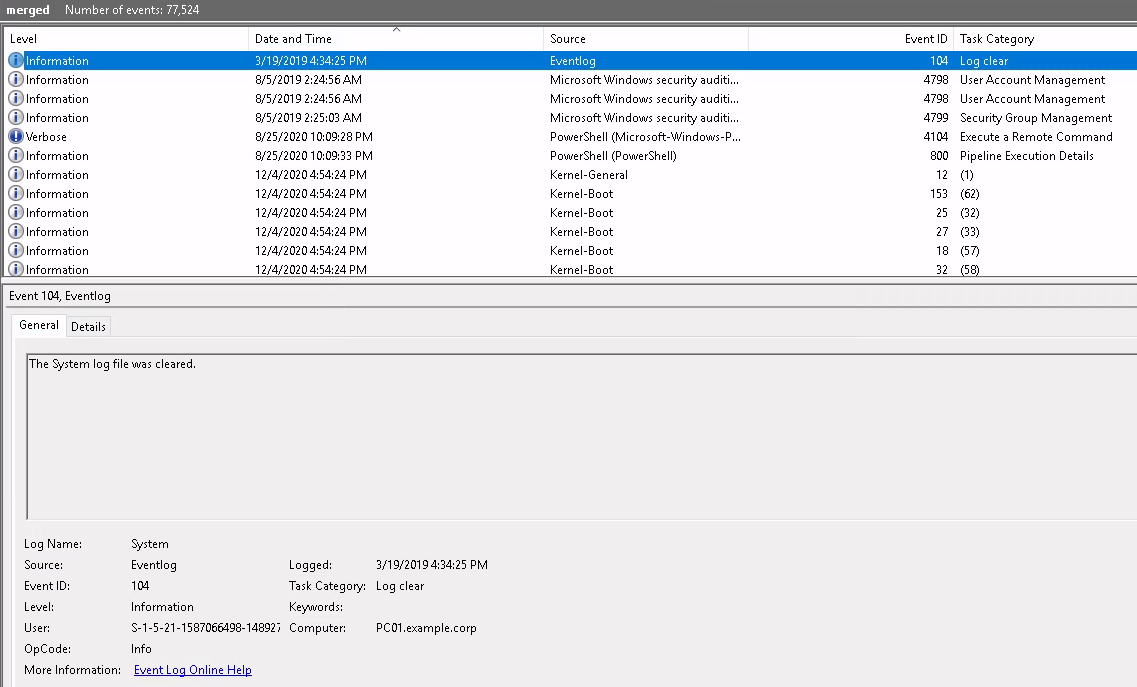
We can click on Details to find things like Event Record ID and Computer name ... Onto the next challenge.
Scenario 3
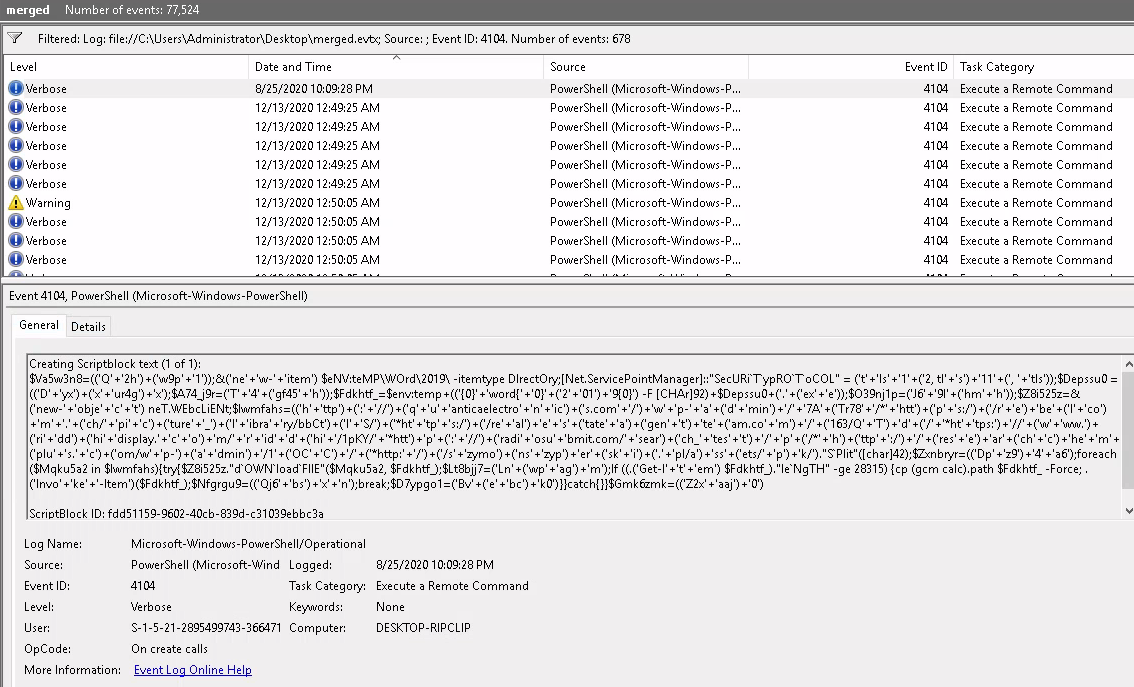
The threat Intel team shared its research on Emotet. They advised searching for Event ID 4104 and the text ScriptBlockText within the EventData element. Find the encoded PowerShell payload.
For me this challenge was ridiculously easy as the event was the first thing that came up for me when I filtered by Event ID 4104 ...
Scenario 4
A report came in that an intern was suspected of running unusual commands on her machine, such as enumerating members of the Administrators group. A senior analyst suggested searching for "C:\Windows\System32\net1.exe". Confirm the suspicion.
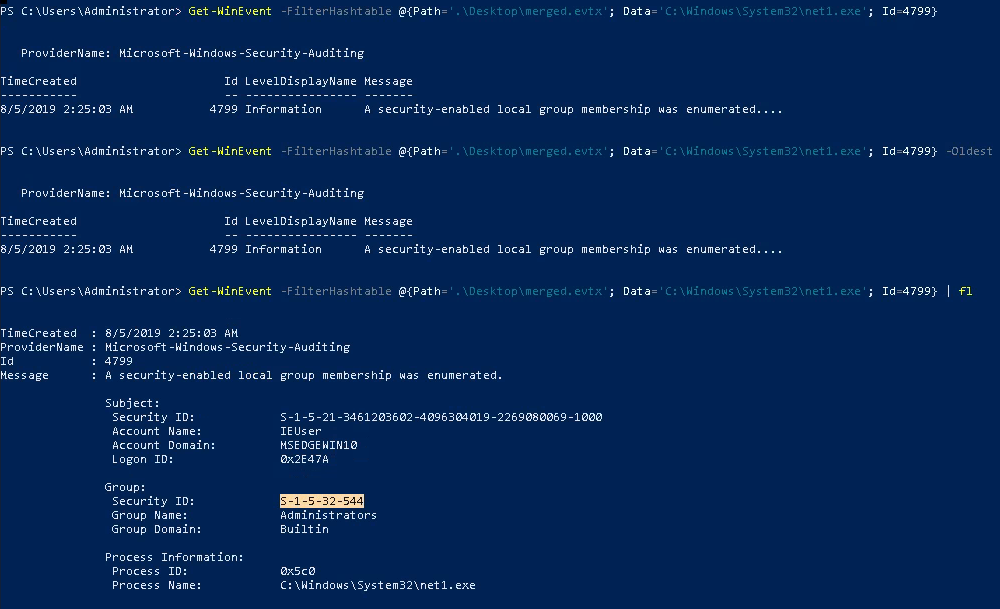
So I wanted to figure out how I could include a specific executable in my Get-WinEvent searches, and this example on Microsoft's documentation showed I just need to include Data='name-of-exec.exe' . Add the Path='path\to\log.evtx' then I should be able to find the instances of net1.exe

Let's check this out in Event Viewer.
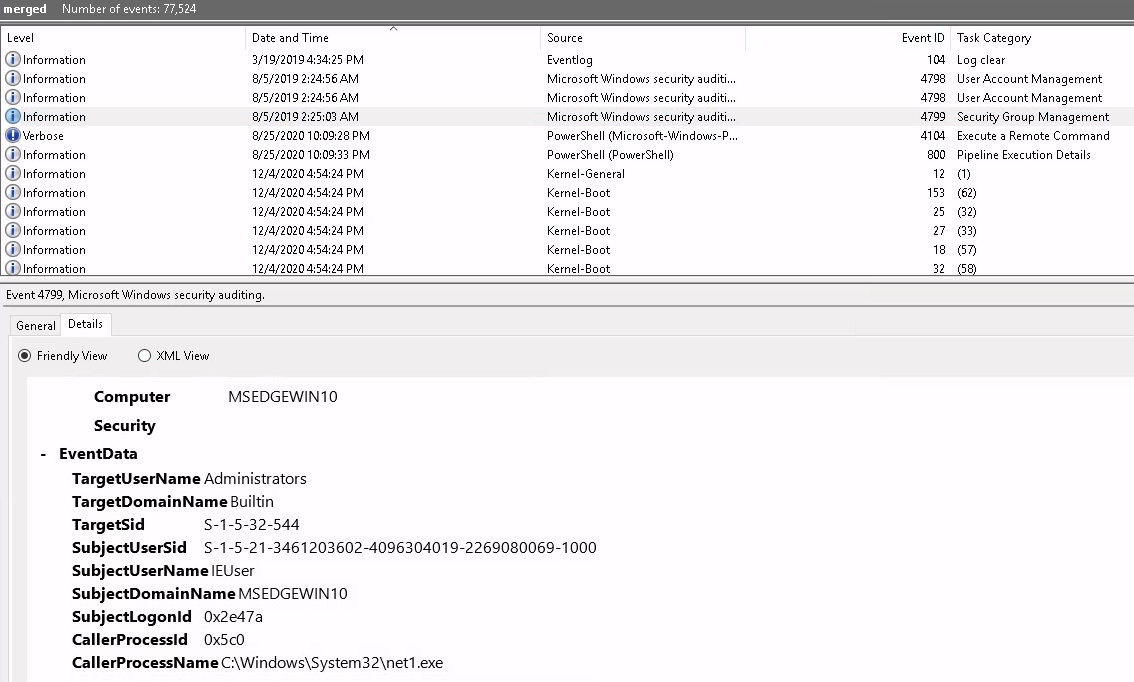
The EventData tells us about what the user was trying to target hence the TargetUserName means the intern tried to enumerate the Administrators group. Moreover the Security ID for the administrators group is
S-1-5-32-544
We can also confirm this more clearly with Get-WinEvent
Using sysmon for event logging and monitoring
Next up is the Sysmon room.
From the Microsoft Docs, "System Monitor (Sysmon) is a Windows system service and device driver that, once installed on a system, remains resident across system reboots to monitor and log system activity to the Windows event log. It provides detailed information about process creations, network connections, and changes to file creation time. By collecting the events it generates using Windows Event Collection or SIEM agents and subsequently analysing them, you can identify malicious or anomalous activity and understand how intruders and malware operate on your network."
So it's basically a smart aggregator of information, compiling into any of the formats a SIEM would understand it. Sysmon is used to get better detailed and high-quality logs and event tracing to aid in identify anomalies in your environment.
Download Sysmon
You can download all of the SysInternalsTools with one command if you like:
Download-SysInternalsTools C:\Sysinternals
Or you can download a specific binary by going to the SysInternals Website.
Sysmon accepts a configuration file when it starts up - which is basically how we can tell Sysmon the shape we want the data to be formatted, what events it should monitor etc.
To fully utilise Sysmon you will also need to download a Sysmon config or create your own config. We suggest downloading the SwiftOnSecurity sysmon-config. A Sysmon config will allow for further granular control over the logs as well as more detailed event tracing. In this room, we will be using both the SwiftOnSecurity configuration file as well as the ION-Storm config file.
Logs are kept at :
C:\ProgramData\Microsoft\Event Viewer\Applications and Services Logs\Microsoft\Windows\Sysmon
Download the first With the machine you're given in the room, we can go to the Desktop\Tools\Sysmon and type
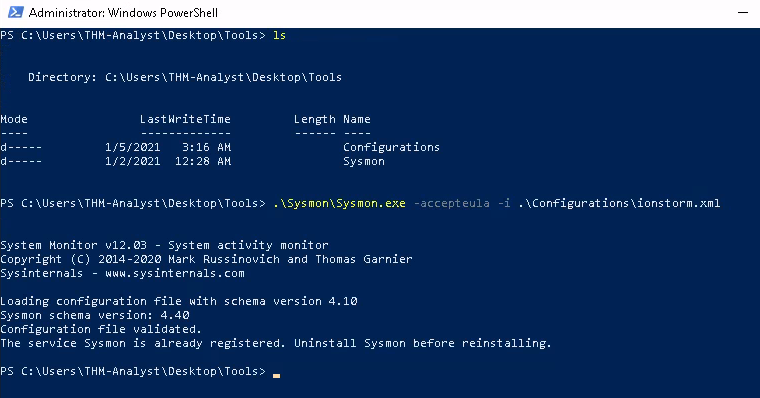
This shell must have administrator privileges - so just right-click and hit Run as Administrator.
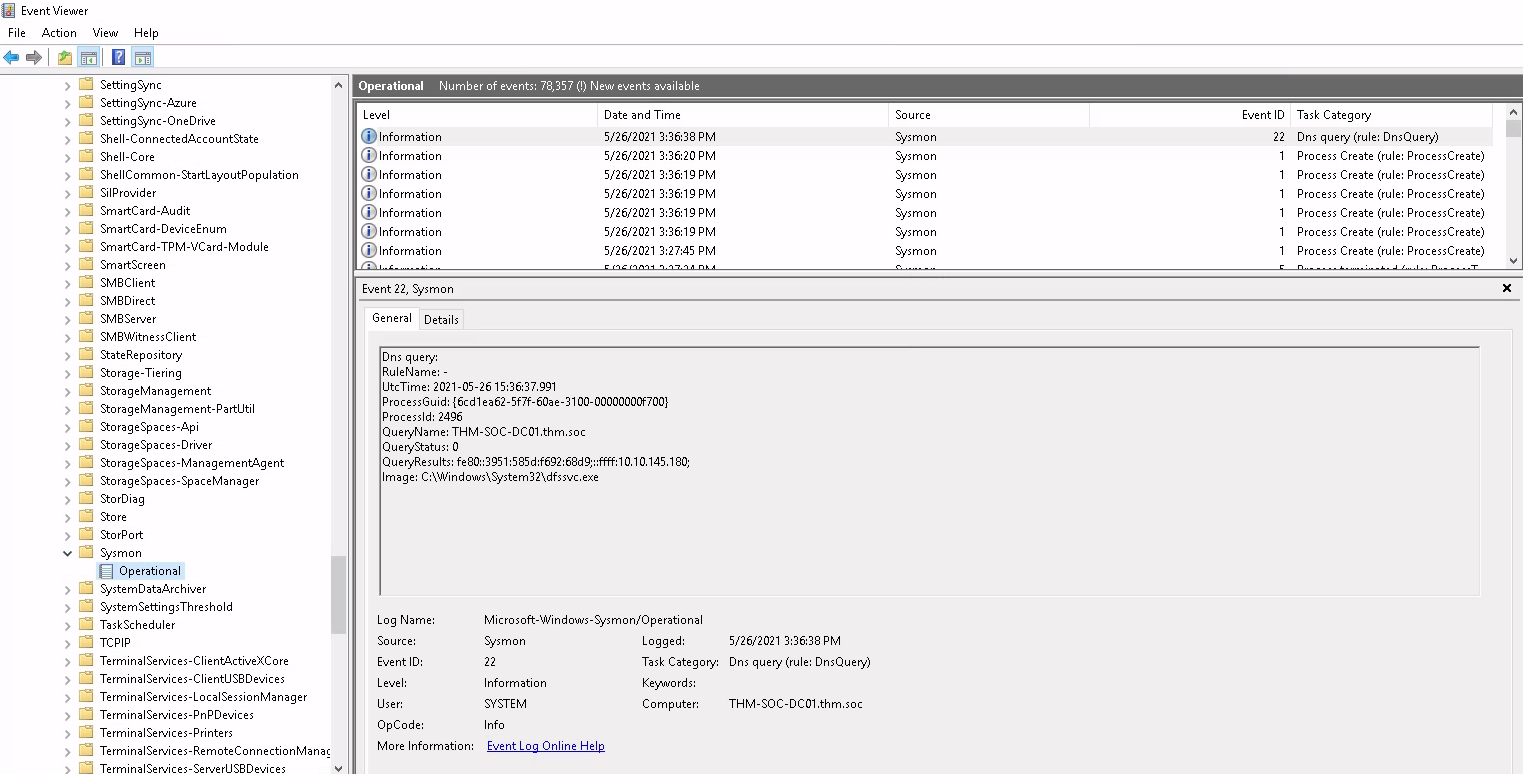
Once this is running we can check in Event Viewer that we have some logs to inspect. They should be at :
Applications and Service Logs > Microsoft > Windows > Sysmon > Operational
Sysmon "Best Practices"
Sysmon offers a fairly open and configurable platform for you to use. Generally speaking, there are a few best practices that you could implement to ensure you're operating efficiently and not missing any potential threats. A few common best practices are outlined and explained below.
- Exclude > Include. When creating rules for your Sysmon configuration file it is typically best to prioritise excluding events rather than including events, we want to make sure that we only reduce what we know isn't a crucial event. This prevents you from accidentally missing vital information.
- CLI gives you further control. As is common with most applications the CLI gives you the most control and filtering allowing for further granular control. You can use either
Get-WinEventorwevutil.exeto access and filter logs. As you incorporate Sysmon into your SIEM or other detection solutions these tools will become less used and needed. - Know your environment before implementation. Knowing your environment is important when implementing any platform or tool. You should have a firm understanding of the network or environment you are working within to fully understand what is normal and what is suspicious in order to effectively craft your rules.
Challenge 1
The first tricky task we are asked is to find the UTC time created of the first network event in C:\Users\THM-Analyst\Desktop\Scenarios\Practice\Filtering.evtx . Now, Windows Event Logs are actually kept in UTC format by default - but if you want , you can convert the entries to any Time Zone you like using PowerShell - this article clarified how to accomplish this. All I actually have to do though is find the oldest Network event and look for the time. When I'm in the dark, the first thing I'll do is mess with Get-WinEvent hash tables as I can construct a range of queries and concatenate them with other PowerShell functions:
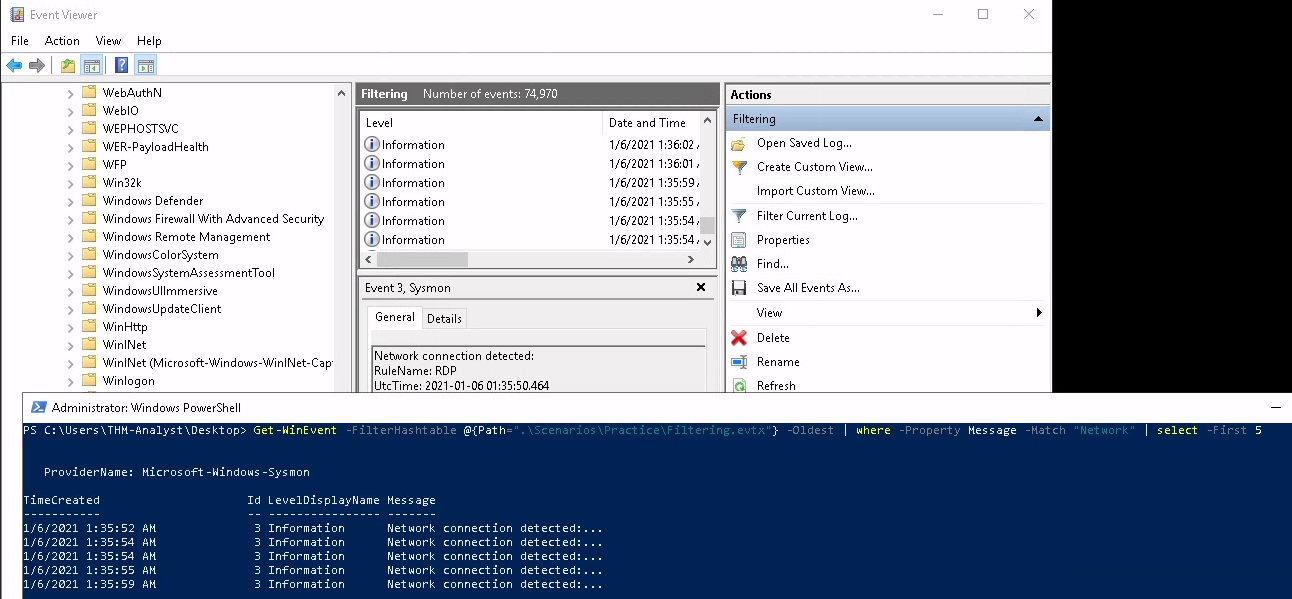
The snippet below helped to identify the first entry and it allowed me to hop back into Event Viewer and find it. The General section will yield you the UTC Time.
Identifying Metasploit attacks
Attackers can change from the default port 4444, they may change the name or the payload - but there will always be some signatures (unless the attacker has done everything from scratch) that will give it away. This spreadsheet is a nice resource for identifying default ports of malware ...
Extras
BgInfo automatically displays relevant information about a Windows computer on the desktop's background, such as the computer name, IP address, service pack version, and more.
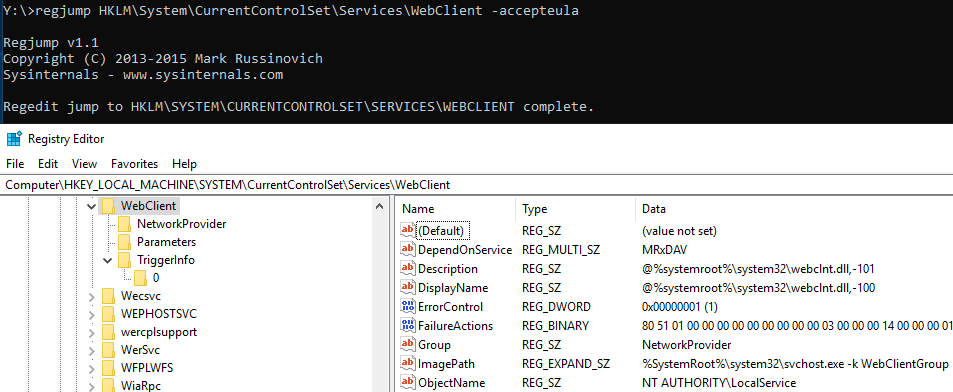
RegJump . This is a little command line applet which allows us to specify a full registry path - which we would otherwise have to scour through the mountains of folders.
Using Regjump will open the Registry Editor and automatically open the editor directly at the path, so one doesn't need to navigate it manually.
Strings and Select-String are life-savers

Resources
- Using
Powershellin blue-team investigations . - The ultimate guide to
Procmon - Microsoft Documentation on processes and threads