Advent of Cyber - Reverse Engineering
Advent of Cyber - Reverse Engineering
In this series we shall be developing a brand new skill ! One that is probably the most intimidating to fledgling hackers, but no matter we have plenty of resources at our aid - and we'll take it one step at a time.
Now then , what is reverse engineering ? Well, first we need to ask ourselves how we engineer programs in the first place. What we do is write our code in human readable language - making use of the all the constructs that a compiler is able to translate into assembly , which is a language that works at the lowest readable-human level - working with registers to push, receive and calculate pure data ... This is then compiled into machine language , which are just a fat-chain of one's and zeroes. Now, when looking at the program to the naked eye it looks indistinguishable from any other machine code, so we need to work our way back into assembly - we need to reverse engineer such binaries if we want to have any chance of comprehending them (this is our only option if we don't have the source code of course).
Machine code doesn't have any indications to when sections start or stop, which may produce some conflicting results in the end - but it does a pretty good job of using the architectural specification in tandem with other tricks to decipher the assembly code back to us.
Each computer has a specific architecture - either 32-bit or 64-bit nowadays. This denotes the maximum length binary string that can travel along the buses on the motherboard, and what the CPU is able to ingest. You can have 64-bit buses on the motherboard but only have a 32-bit CPU but not vice versa , as it would have to break up those bigger strings to be transmitted.
Task 17 : [Reverse Engineering] ReverseELFneering
To conduct our reverse engineering we will make use of the radare framework - which is allows us to reverse engineer and analyse binaries. It can be used to disassemble binaries (translate machine code to assembly, which is actually readable) and debug said binaries (by allowing a user to step through the execution and view the state of the program).
The executable that we have to analyse is a simple one

Here we can note the variable names and there values ... which makes this easier - but we can begin to inspect for such values ! Load up radare by doing
r2 -d ./file1

;; -d for debugging
;; other options can be explained in the docs here
;; https://book.rada.re/first_steps/commandline_flags.html
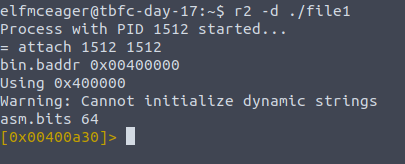
Looking in the analysis section of the docs we see that typing in ? will allow us to see available commands, such as aa which stands for analyse all. We can do aa? to check the documentation for what it actually does, and other options available to us. aa stands for analyse all, and that will be what we often do first to allow the debugger to churn through the code. It analyses all flags, entry points, variables you name it so it will take a few minutes, but then we begin wading through the binary waters. Often times in a program, the starting point will be at main or some similar thing like start etc. We can look at a of the functions list by typing
afl | grep main

;; there is alot of output, and we only want to see the reference for main
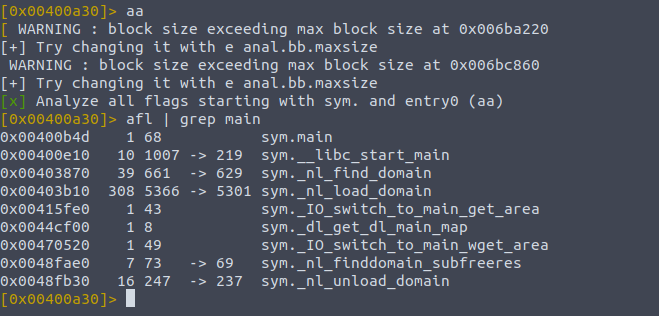
So we can see it found the main symbol, and we can disassemble this function into its opcodes , which just means all of its operations. To do this we type pdf , for print dissasembly function.
pdf @main

;; note all symbols are referenced with an @
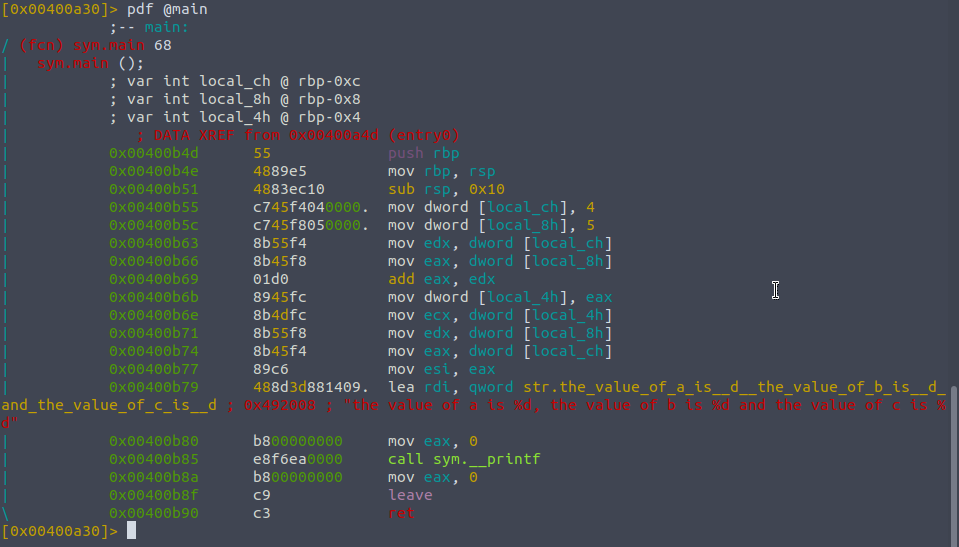
You can see how many things we have to move around just to print something to the console , but radare has formatted it so we can keep track of all the variables used.
Looking at sym.main we can see that there are three variables , the second column denoting their type to int , the third column is the name that radare uses to reference the variables and the last section is to denote their respective memory location. The logic of the function is below and shows all the different assembly opcodes, with the corresponding address that the instruction or value is stored at. This will be important for when we want to use breakpoints, as we will need to reference the memory address to say where the stoppage will be.
Using breakpoints will allow us to stop programs at desirable points - as we want to see the contents of all the registers at that point in time. Sifting through the changes, and going instruction by instruction will allow us to watch the behaviour of the program and at such granular speeds the weaknesses become more visible.
We can see that the fourth instruction moves the value for into the local_ch variable, so we can add a breakpoint just there by doing db 0x00400b55 though the address may be different for you. Now when we run this again we see the little b showing us that when we hit that point the compiler sees the breakpoint and won't execute the instruction associated.
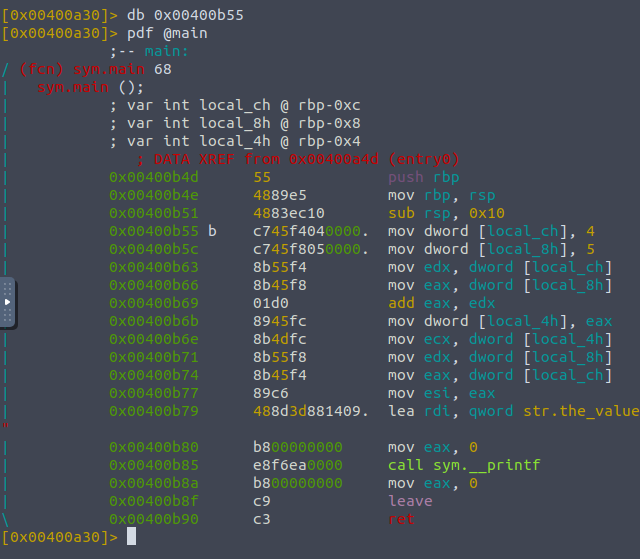
We can run a program which will stop at a breakpoint by doing "do continuation" or dc.
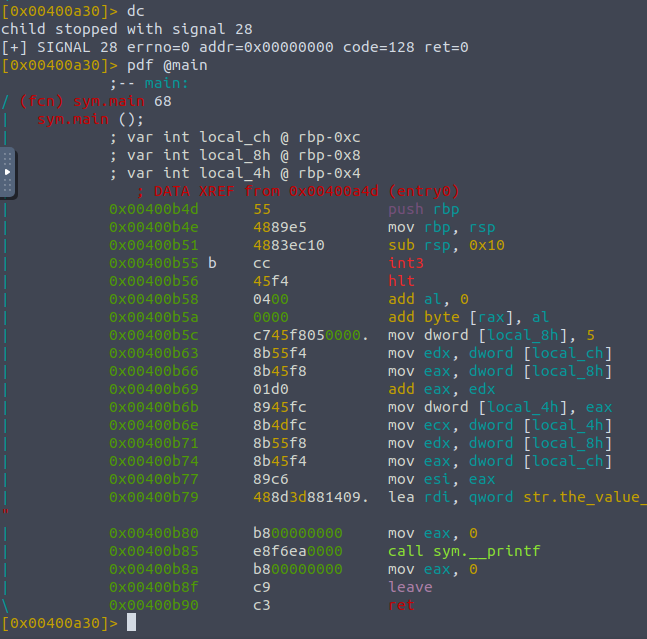
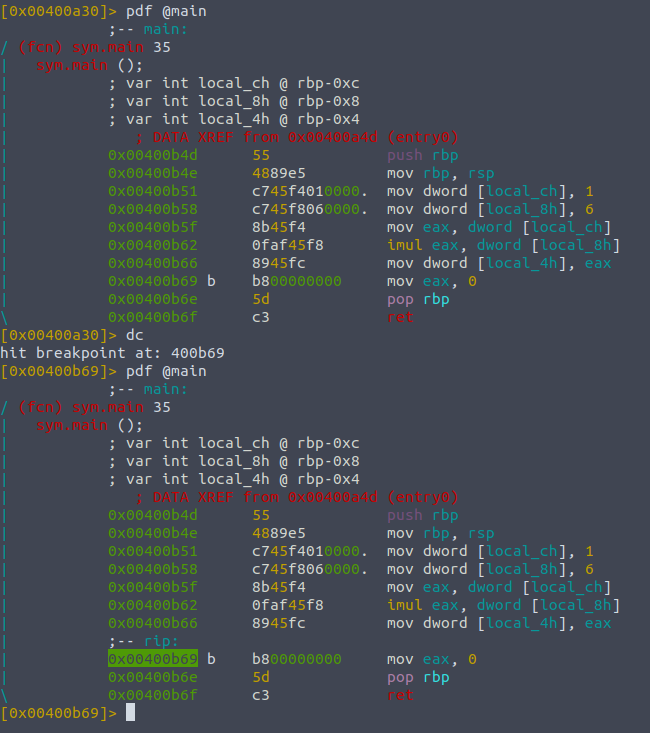
The whole int3 thing is used by the radare debugger to denote the fact that an instruction needed replacing as we hit a breakpoint, the next instruction is to hlt for now. What we should be seeing is this:
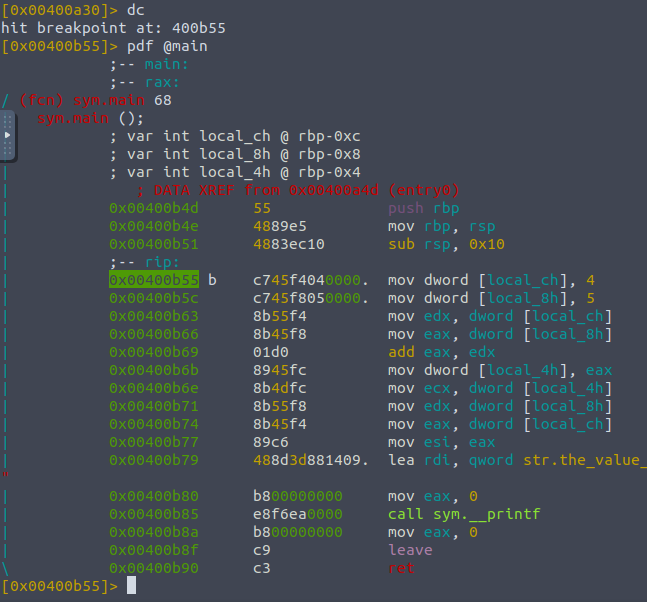
I just spammed ds a good few times to get to that instruction point, dc to compile and then pdf again, keep trying until you see the ;-- rip as this shows that the program has landed on that address but has halted...
Now that the program is set up like this with our breakpoint , we can inspect the contents of the registers of the variables local_ch etc. We can print the contents of their memory by doing
px @memory-address
;; print hexadecimal...

px rbp-0xc
;; in this case
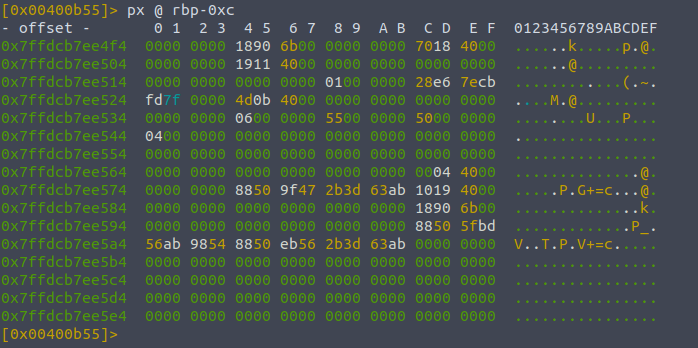
And we can run "do step" - ds to run each instruction one by one, typing it once should run the instruction that we stopped at , hence adding four into this memory space hopefully:
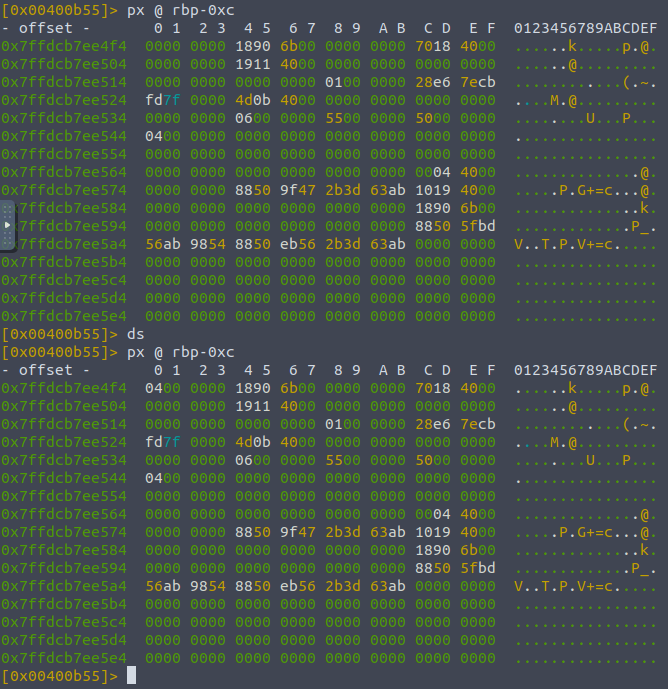
When we want to check the change in registers instead of variables we can do dr instead and find the register we added the value to. The first instruction which adds to registers is the
mov dword, [local_ch] , 4
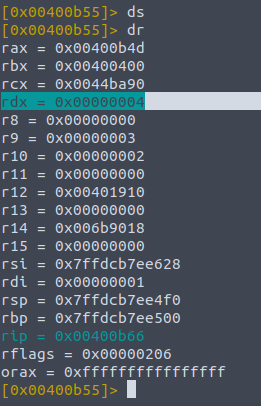
Just keep moving with ds , checking the current pointer position with pdf @main and dr to see if the value landed.
Right then , it's time we tested our newfound skills against the challenge file - enough practice ! Let's load it up the exact same way and take a peek at the pdf for @main.
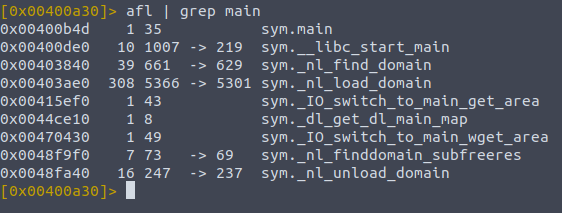
This program also has a main symbol - and let's load it up
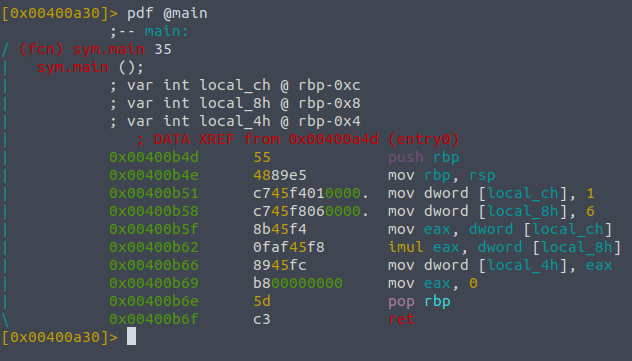
We can see the first two answers just by looking at the program , where local_ch is 1 and we would just type ds three times to confirm that. Looking at imul - which is a multiply instruction - we see the eax register is getting its value multiplied by the value of local_8h - 6.
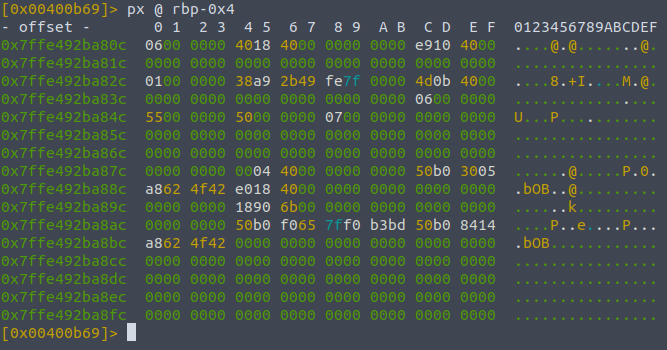
Lastly , we need to set a breakpoint at mov eax, 0 so we can see the local_4h variable before that instruction is called.
And that's it ! Onto the next reverse engineering.